
 EN
EN
 ar
ar bg
bg hr
hr cs
cs da
da nl
nl fi
fi fr
fr de
de el
el hi
hi it
it ko
ko no
no pl
pl pt
pt ro
ro ru
ru es
es sv
sv tl
tl iw
iw id
id lv
lv lt
lt sr
sr sk
sk sl
sl uk
uk vi
vi et
et hu
hu th
th tr
tr fa
fa ms
ms hy
hy ka
ka ur
ur bn
bn mn
mn ta
ta kk
kk uz
uz ku
ku
load cell wiring diagram
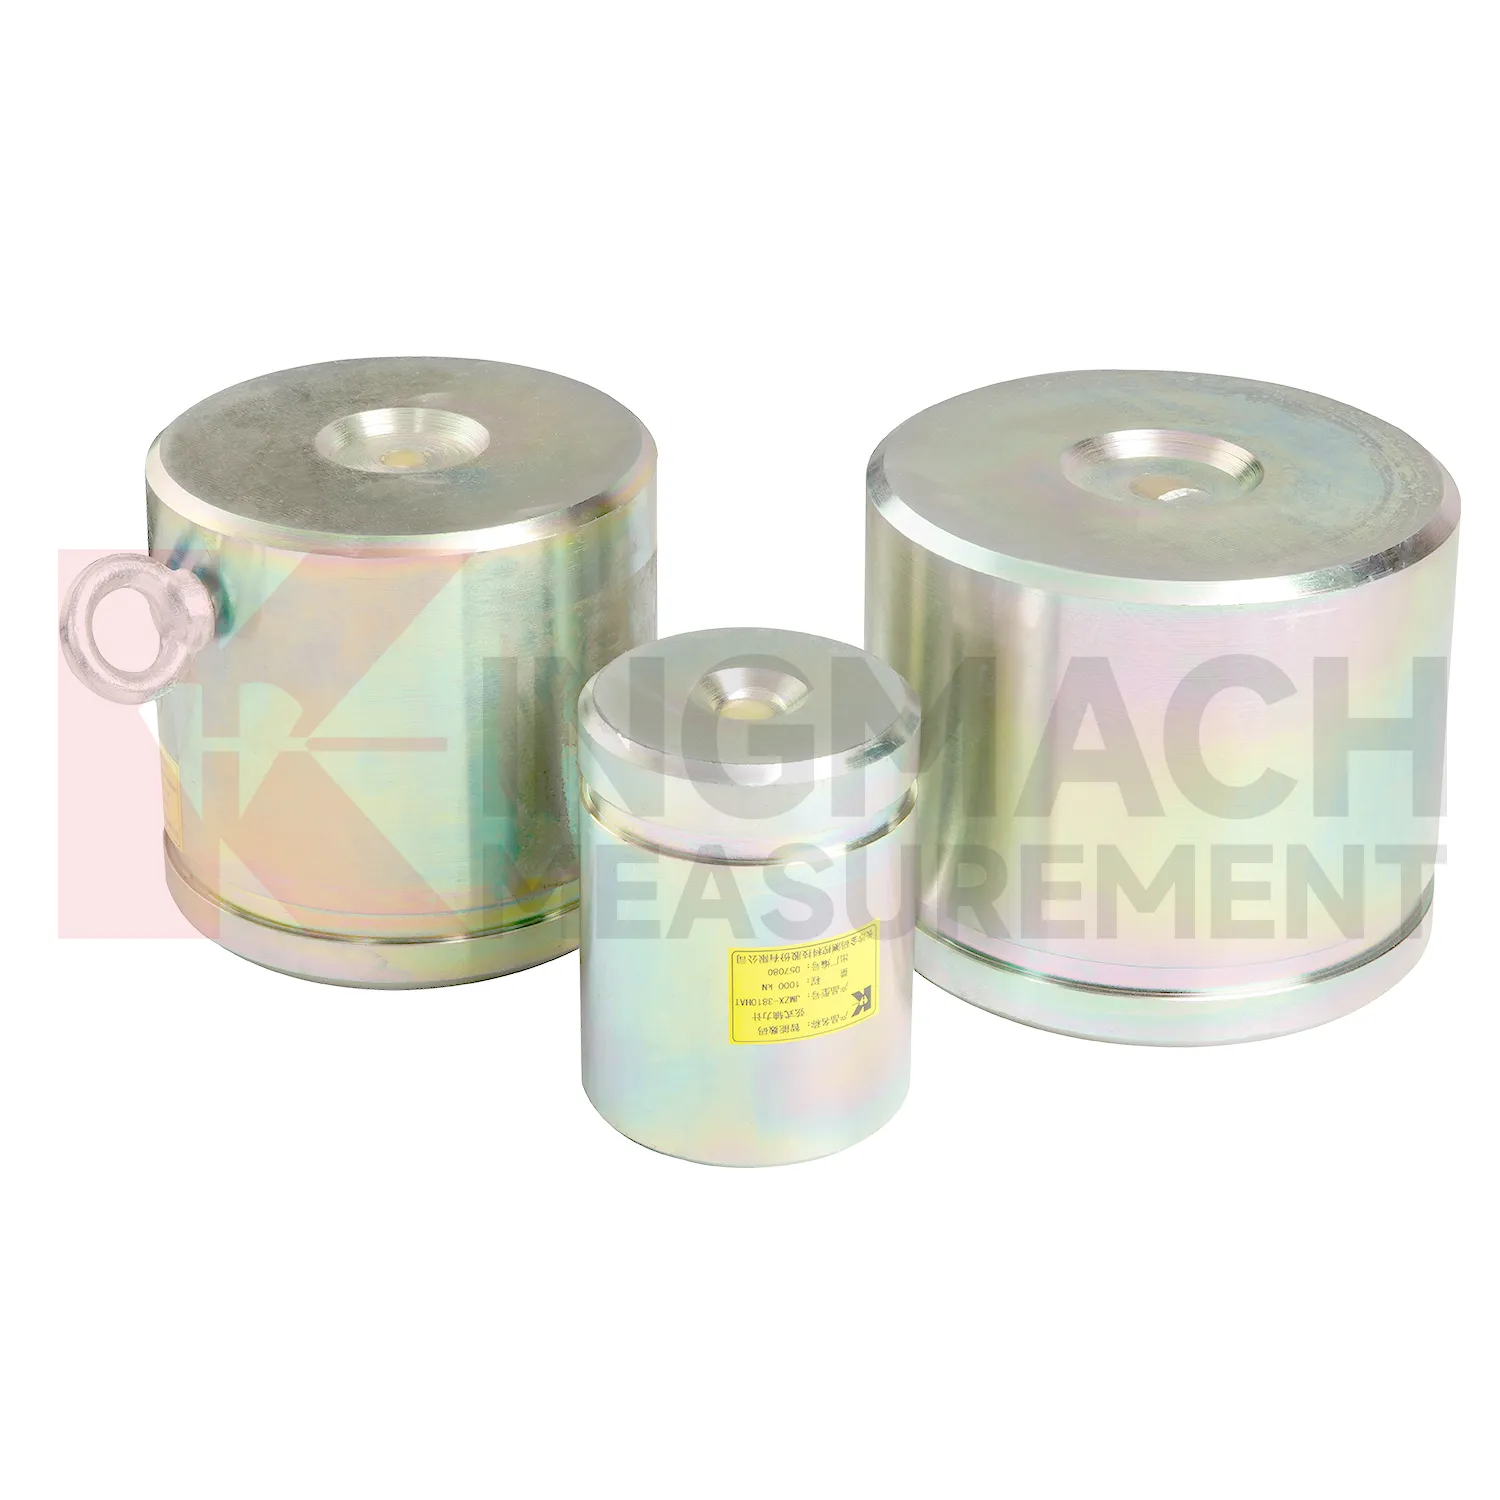
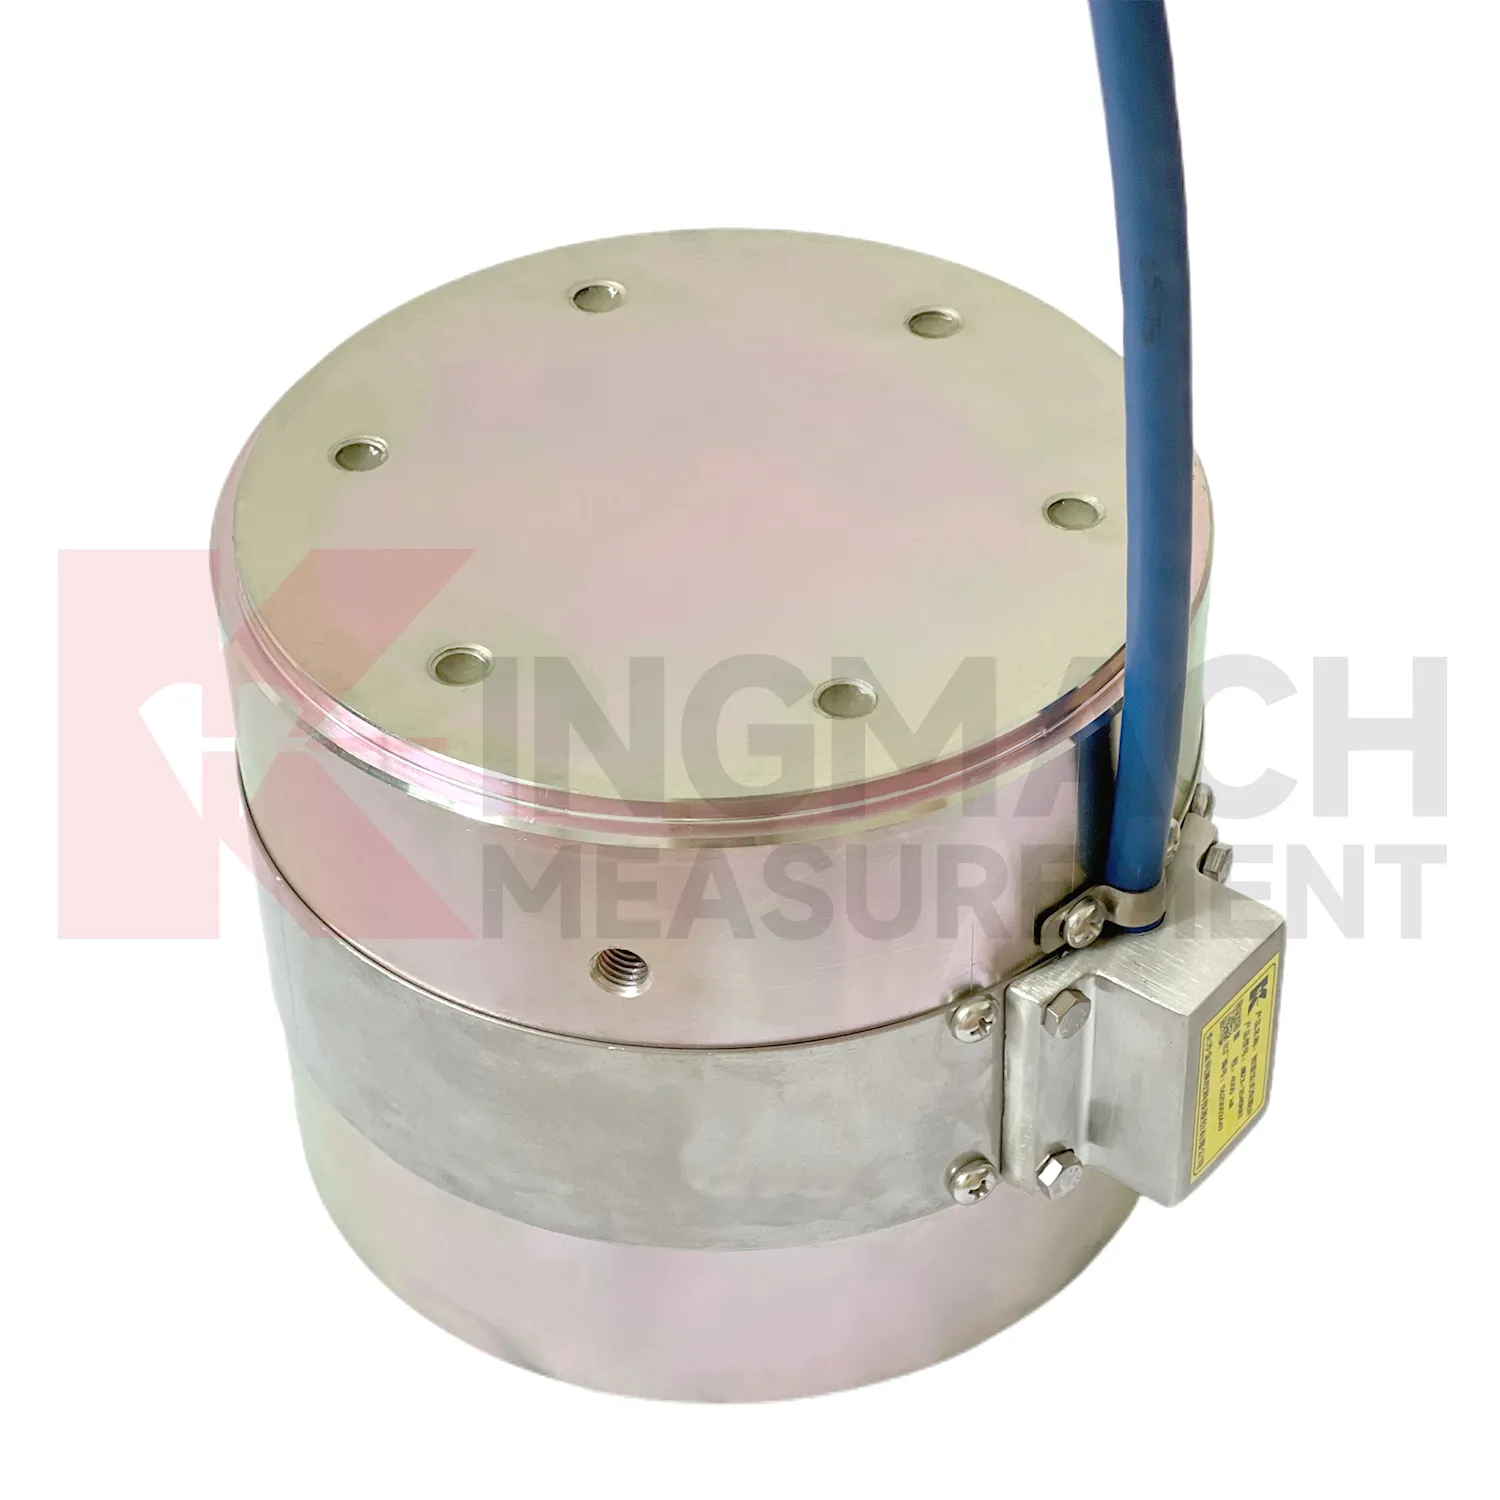
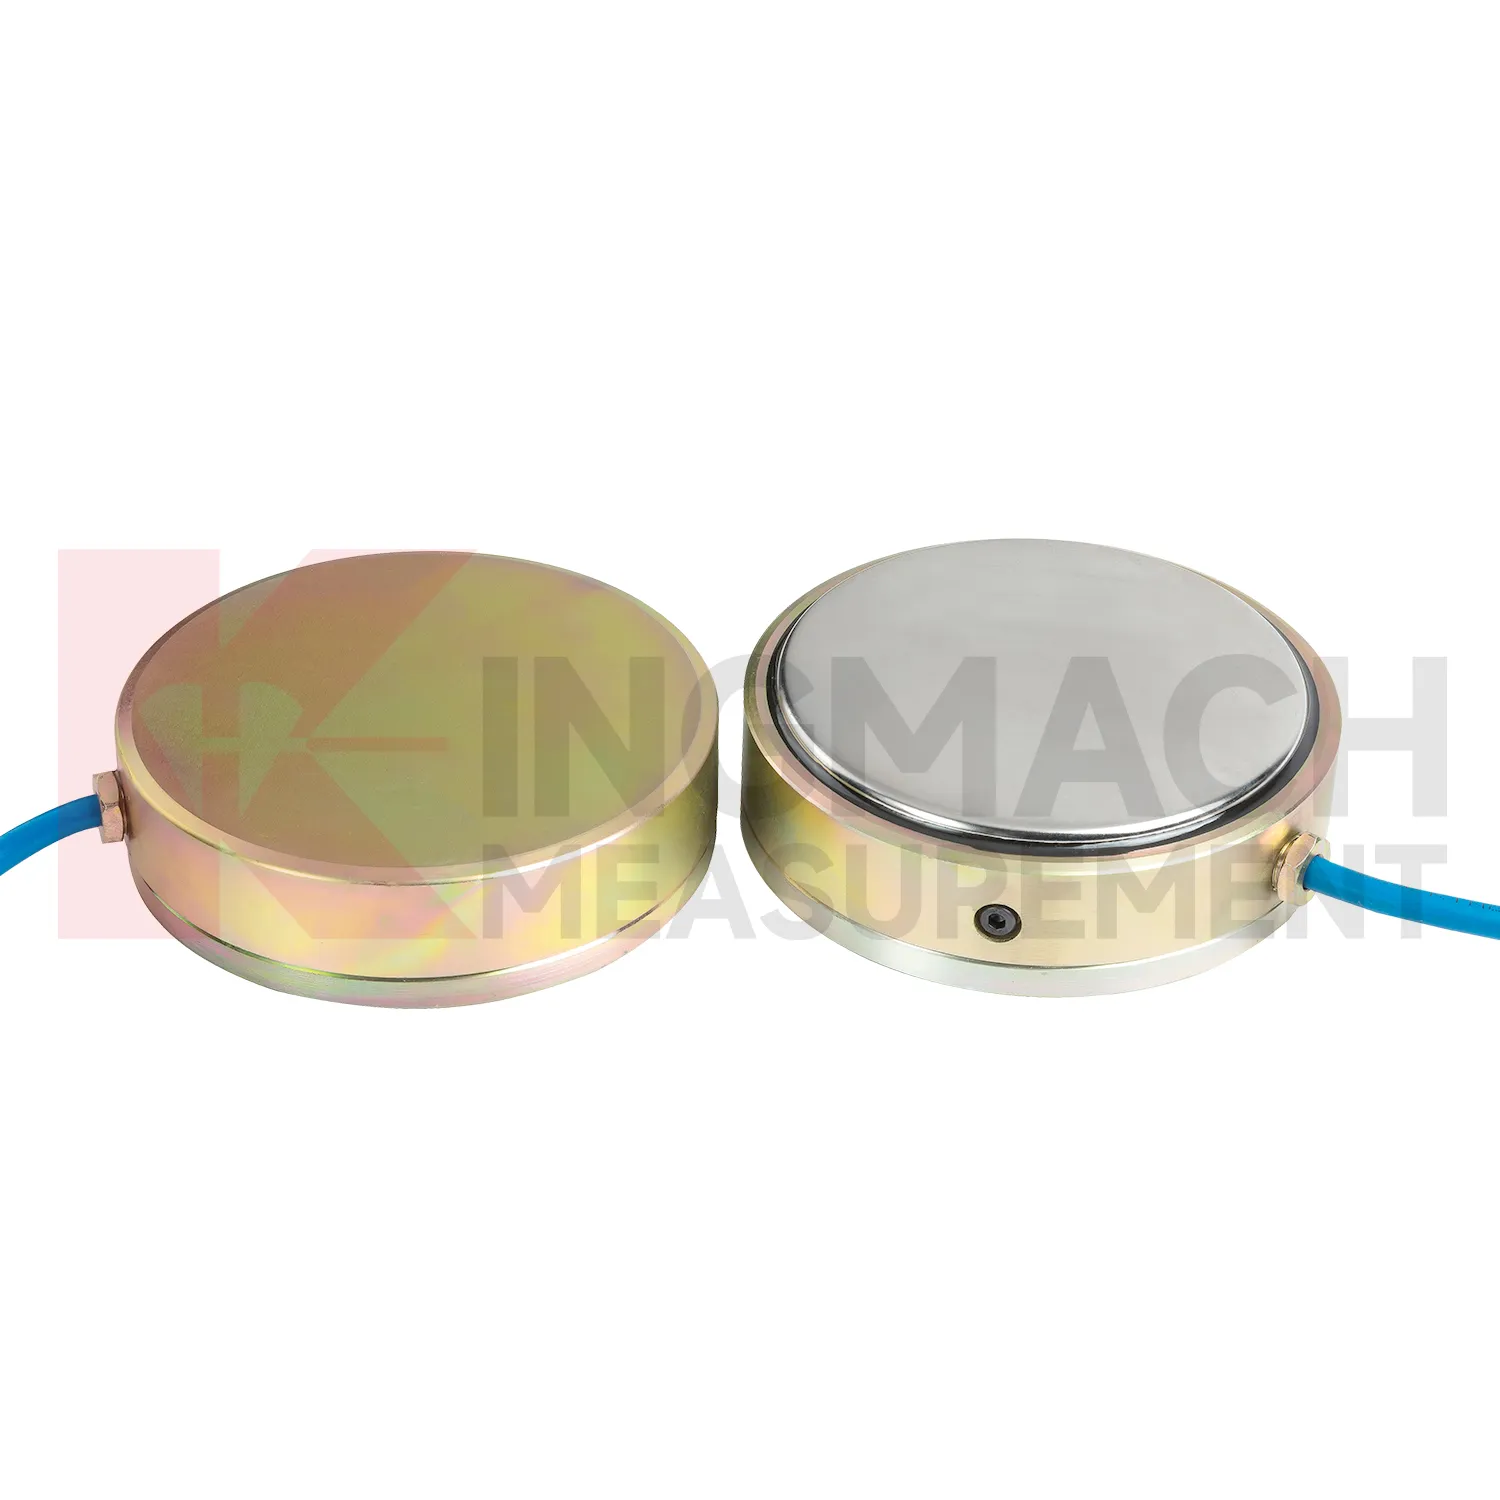
Kingmach load cell wiring diagram can be specified as part of a complete monitoring workflow rather than as a standalone instrument. Product pages mention manual readout compatibility, comprehensive vibrating wire readouts, automated acquisition, and storage of model or calibration information inside smart sensors. On listed models, force ranges extend from 200 kN on smaller axial force meters to 10000 kN on high capacity solid load cells, while pressure related models cover 0.3 MPa to 8 MPa. The presence of temperature correction, waterproof construction, digital output, and stable vibrating wire sensing helps the same installation work through construction and service periods. Kingmach's support range includes data loggers, instrumentation cables, and visualization software, so project teams can plan channel naming, alarm limits, report format, and maintenance inspection around the sensor from the beginning. That reduces later confusion when hundreds of monitoring points are installed across a bridge, subway, dam, slope, or foundation project. Viewed as a package, the product, readout, cable, calibration record, and software connection all affect data quality. Kingmach's catalog structure helps buyers think about that whole chain rather than treating the sensor as a loose component. For long projects, that shared record reduces confusion when installation teams, monitoring teams, and maintenance teams are not the same people.
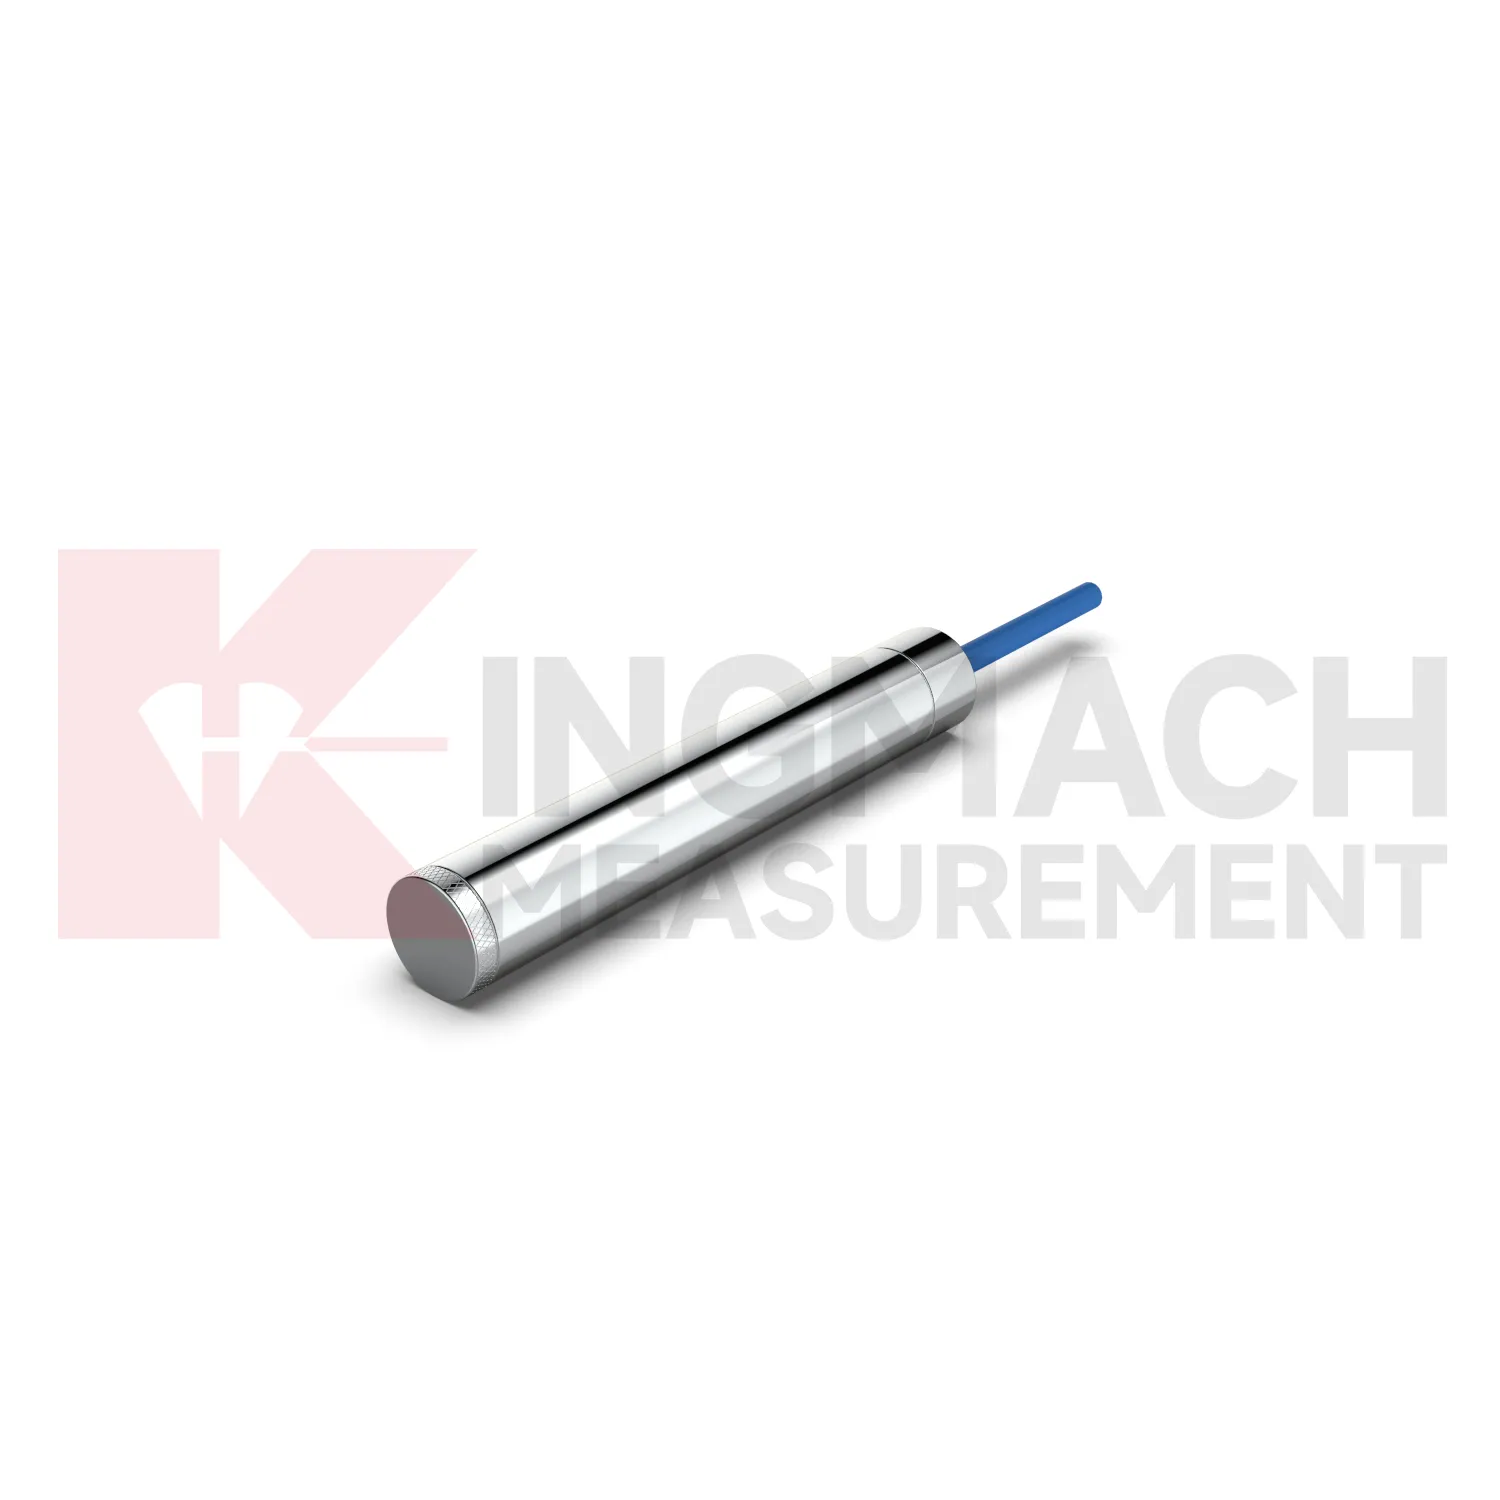
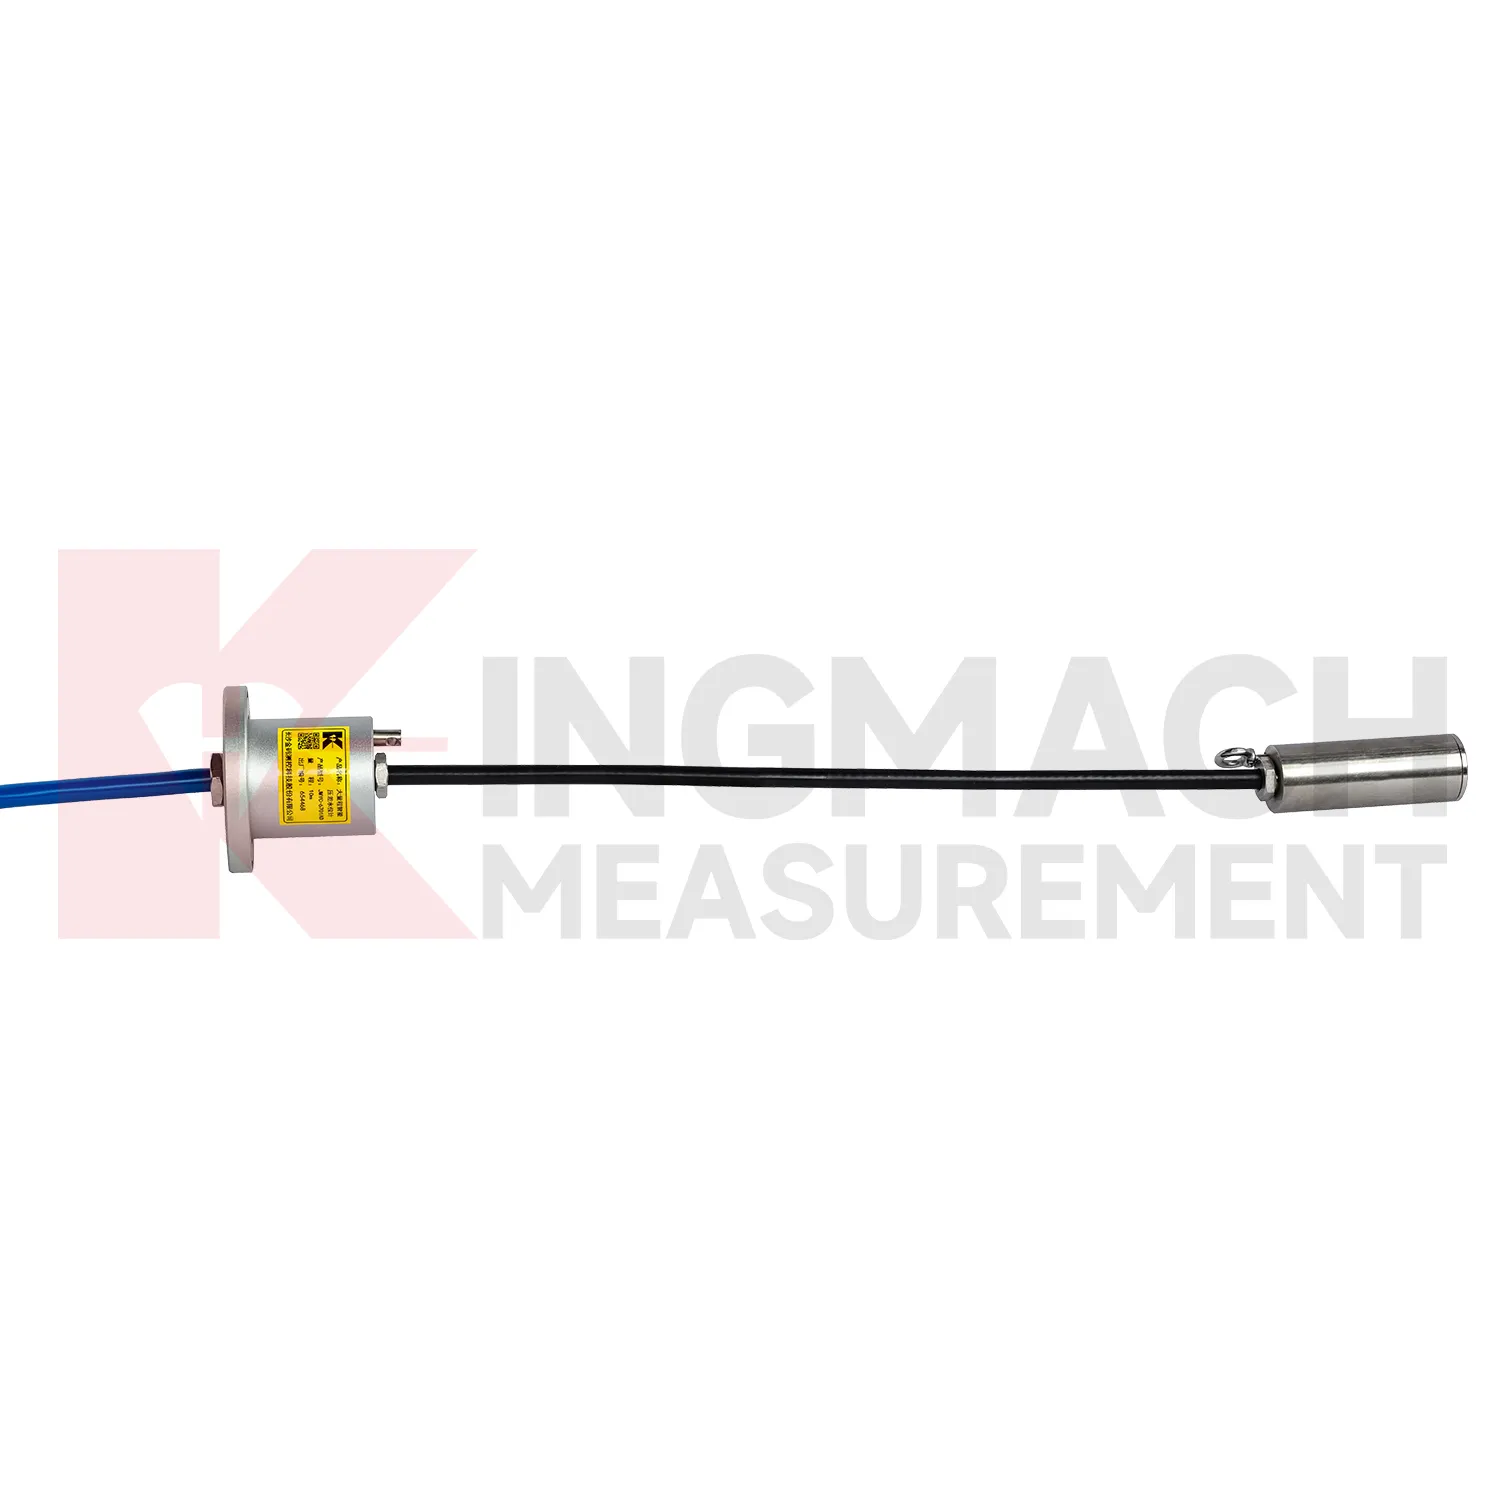
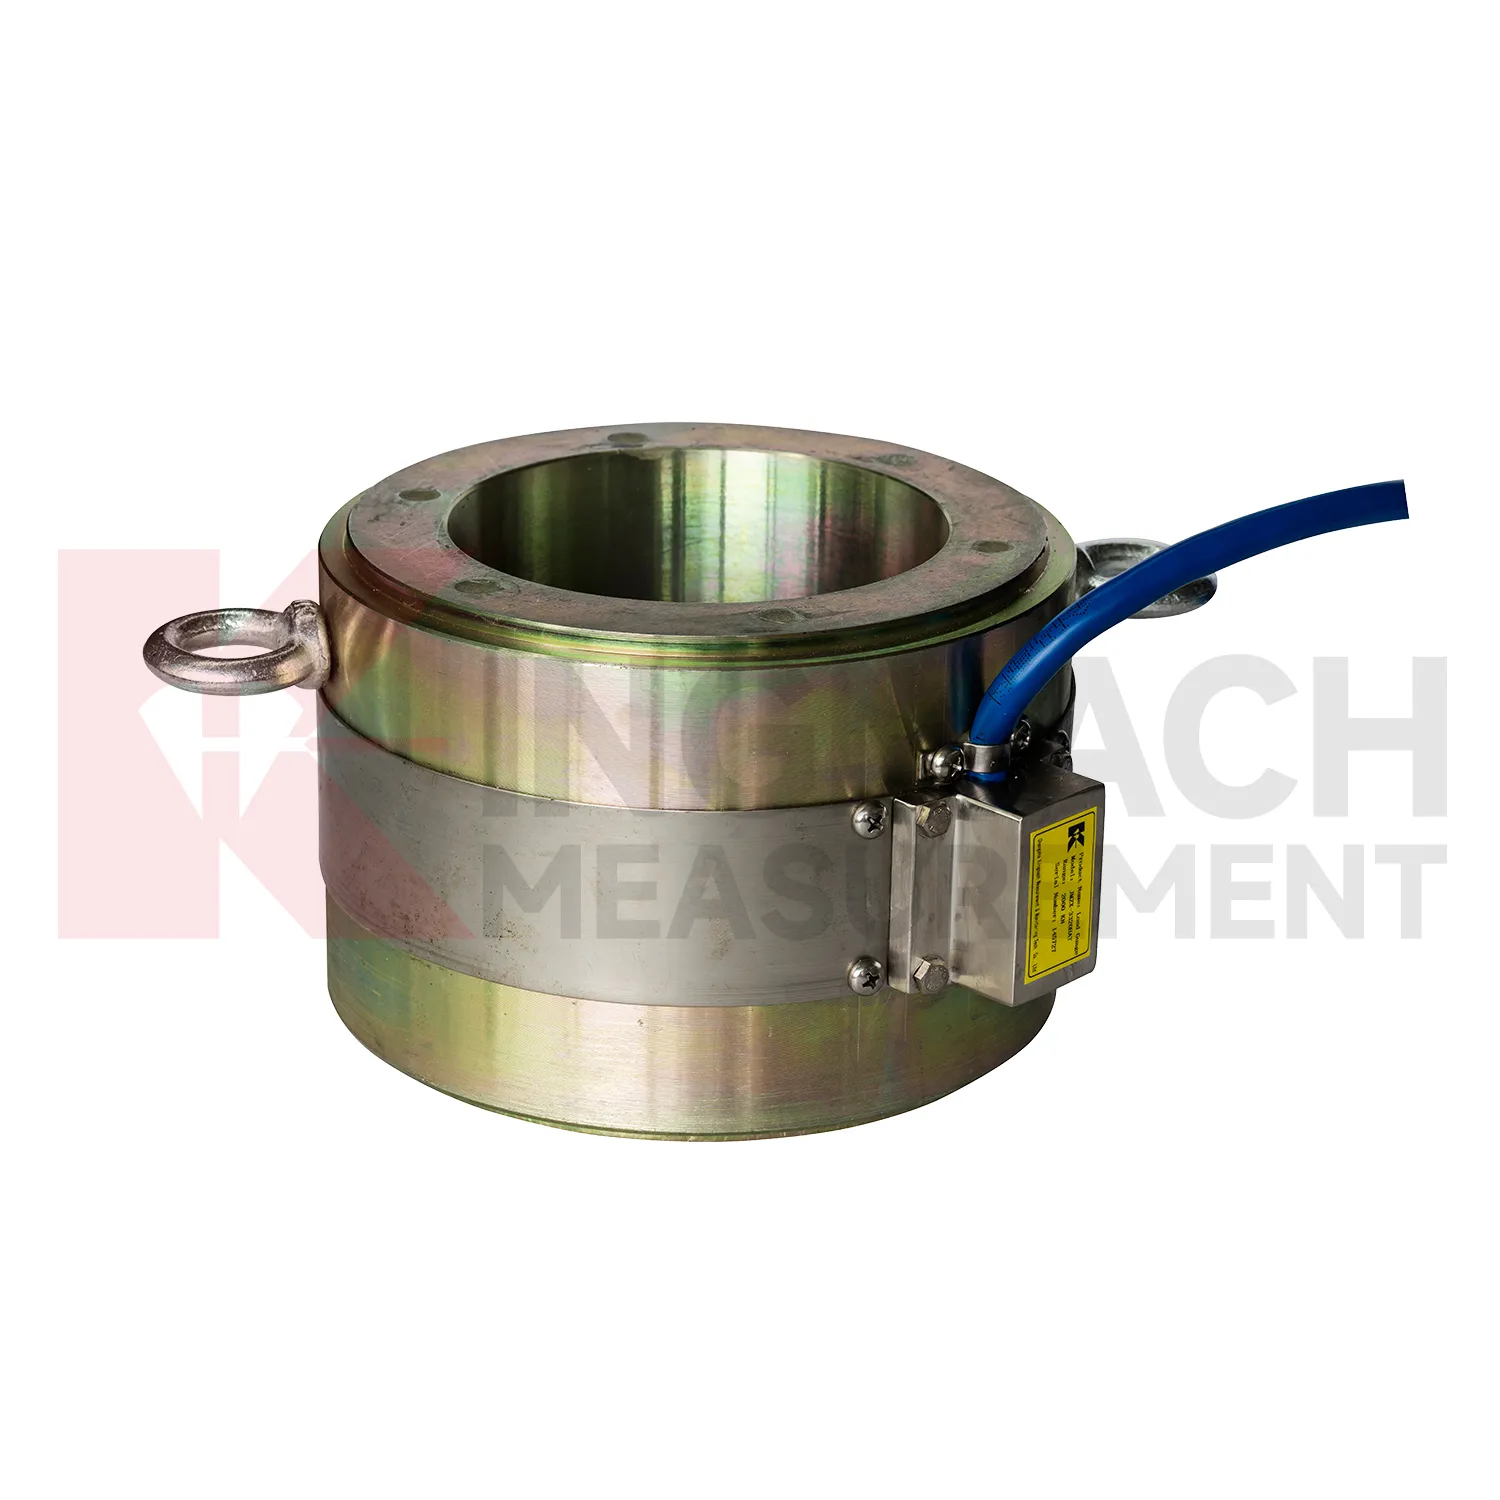
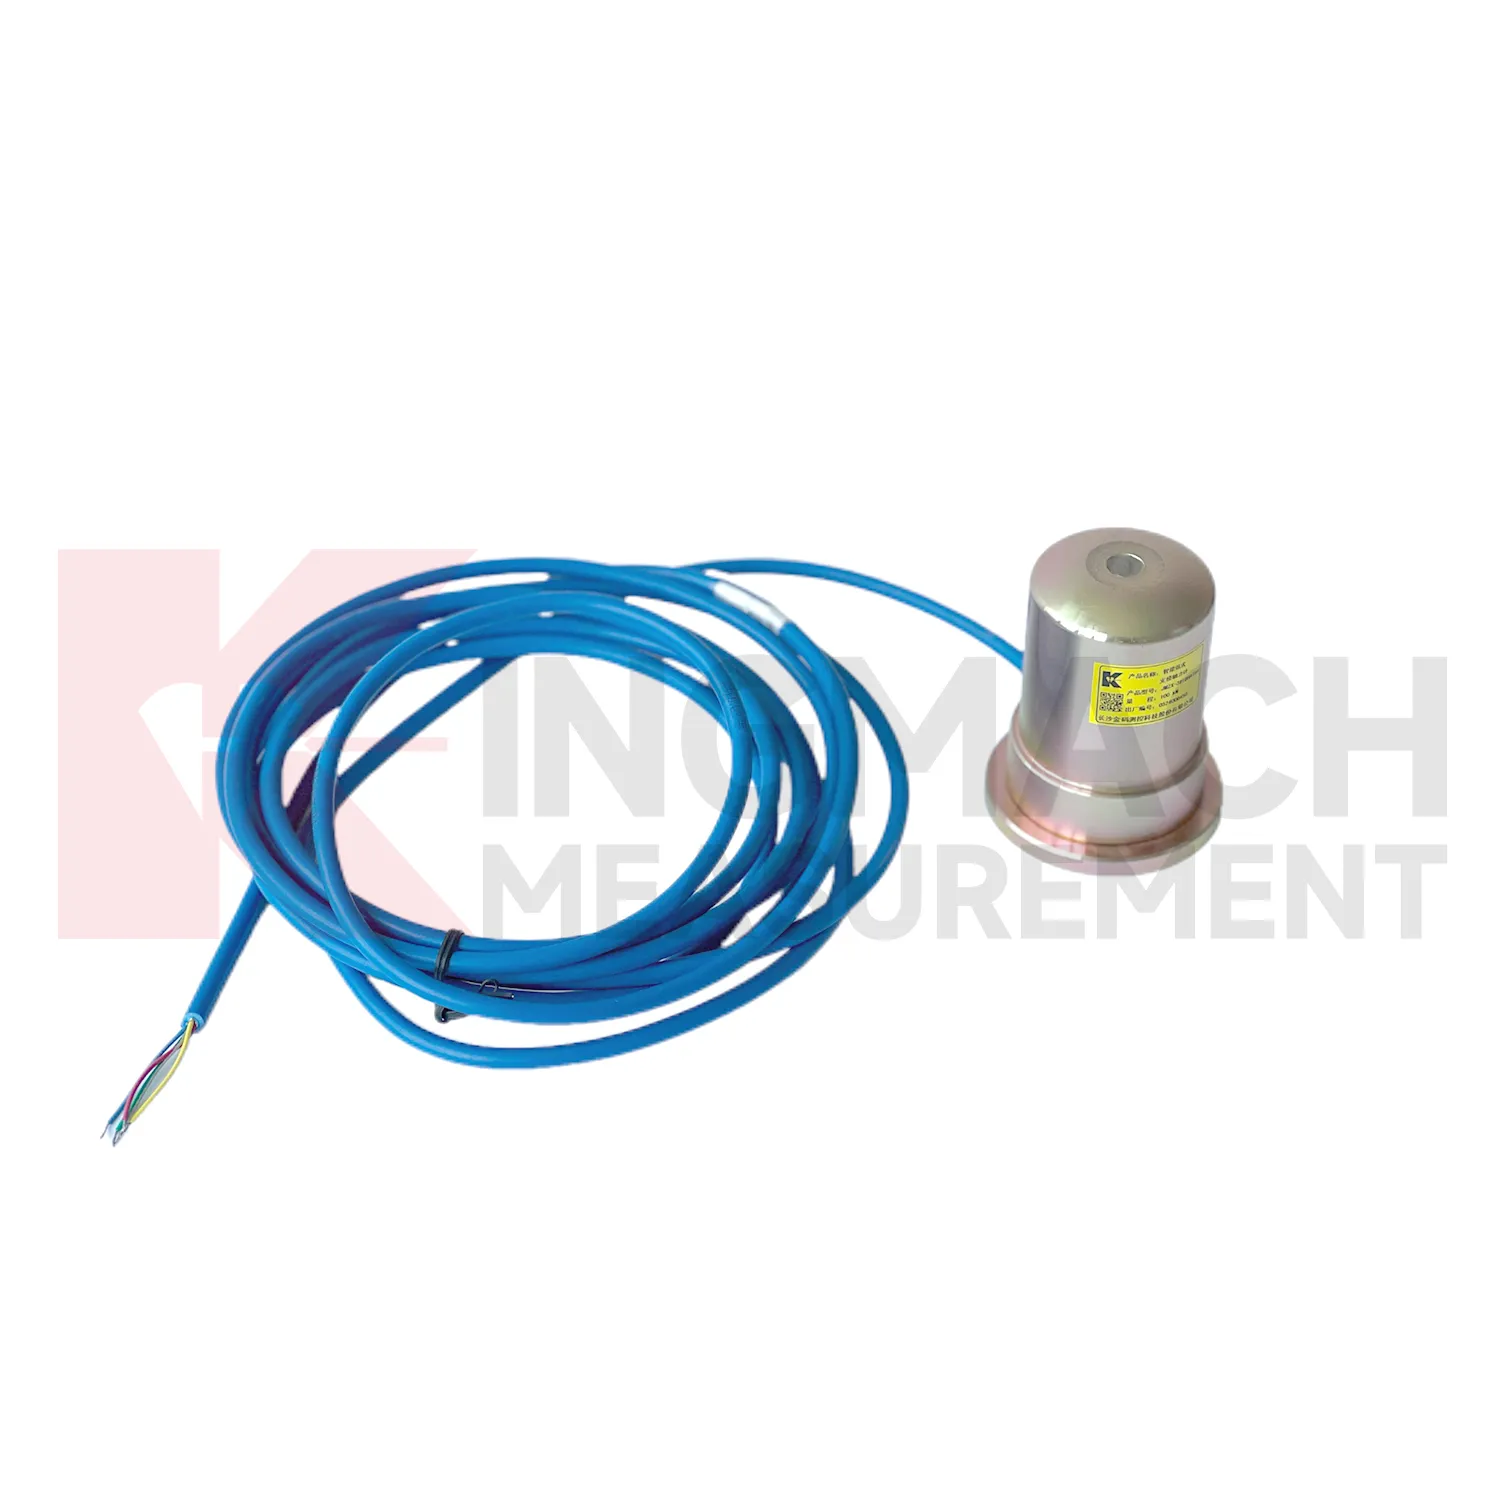
Application of load cell wiring diagram
In pile load testing and bearing capacity verification, load cell wiring diagram helps track applied force, load stages, unloading response, and residual behavior. The common problem is uncertainty around whether the applied load is centered and whether the recorded value matches the actual force passing through the test system. Kingmach solid load cells such as JMZX-35XXHAT list 1000 kN to 10000 kN ranges, 0.1 kN resolution, and 0.5%FS precision, with overload information listed as 20 to 50%F.S. range overload and 300 to 400%F.S. failure overload. These figures suit heavy test work when capacity margin must be checked before the sensor is installed. During the test, the record should include each loading step, hold time, unloading step, zero check, temperature, and any change to the bearing arrangement. Pairing the load record with settlement readings gives a clearer view of pile response. After the test, the documented calibration coefficient and instrument identity help keep the acceptance file defensible. Test reports should also record jack pressure, settlement response, load rate, hold duration, and any adjustment to the reaction system. These records help engineers identify whether an unusual load value came from the pile, the loading setup, or the measurement chain.
The future of load cell wiring diagram
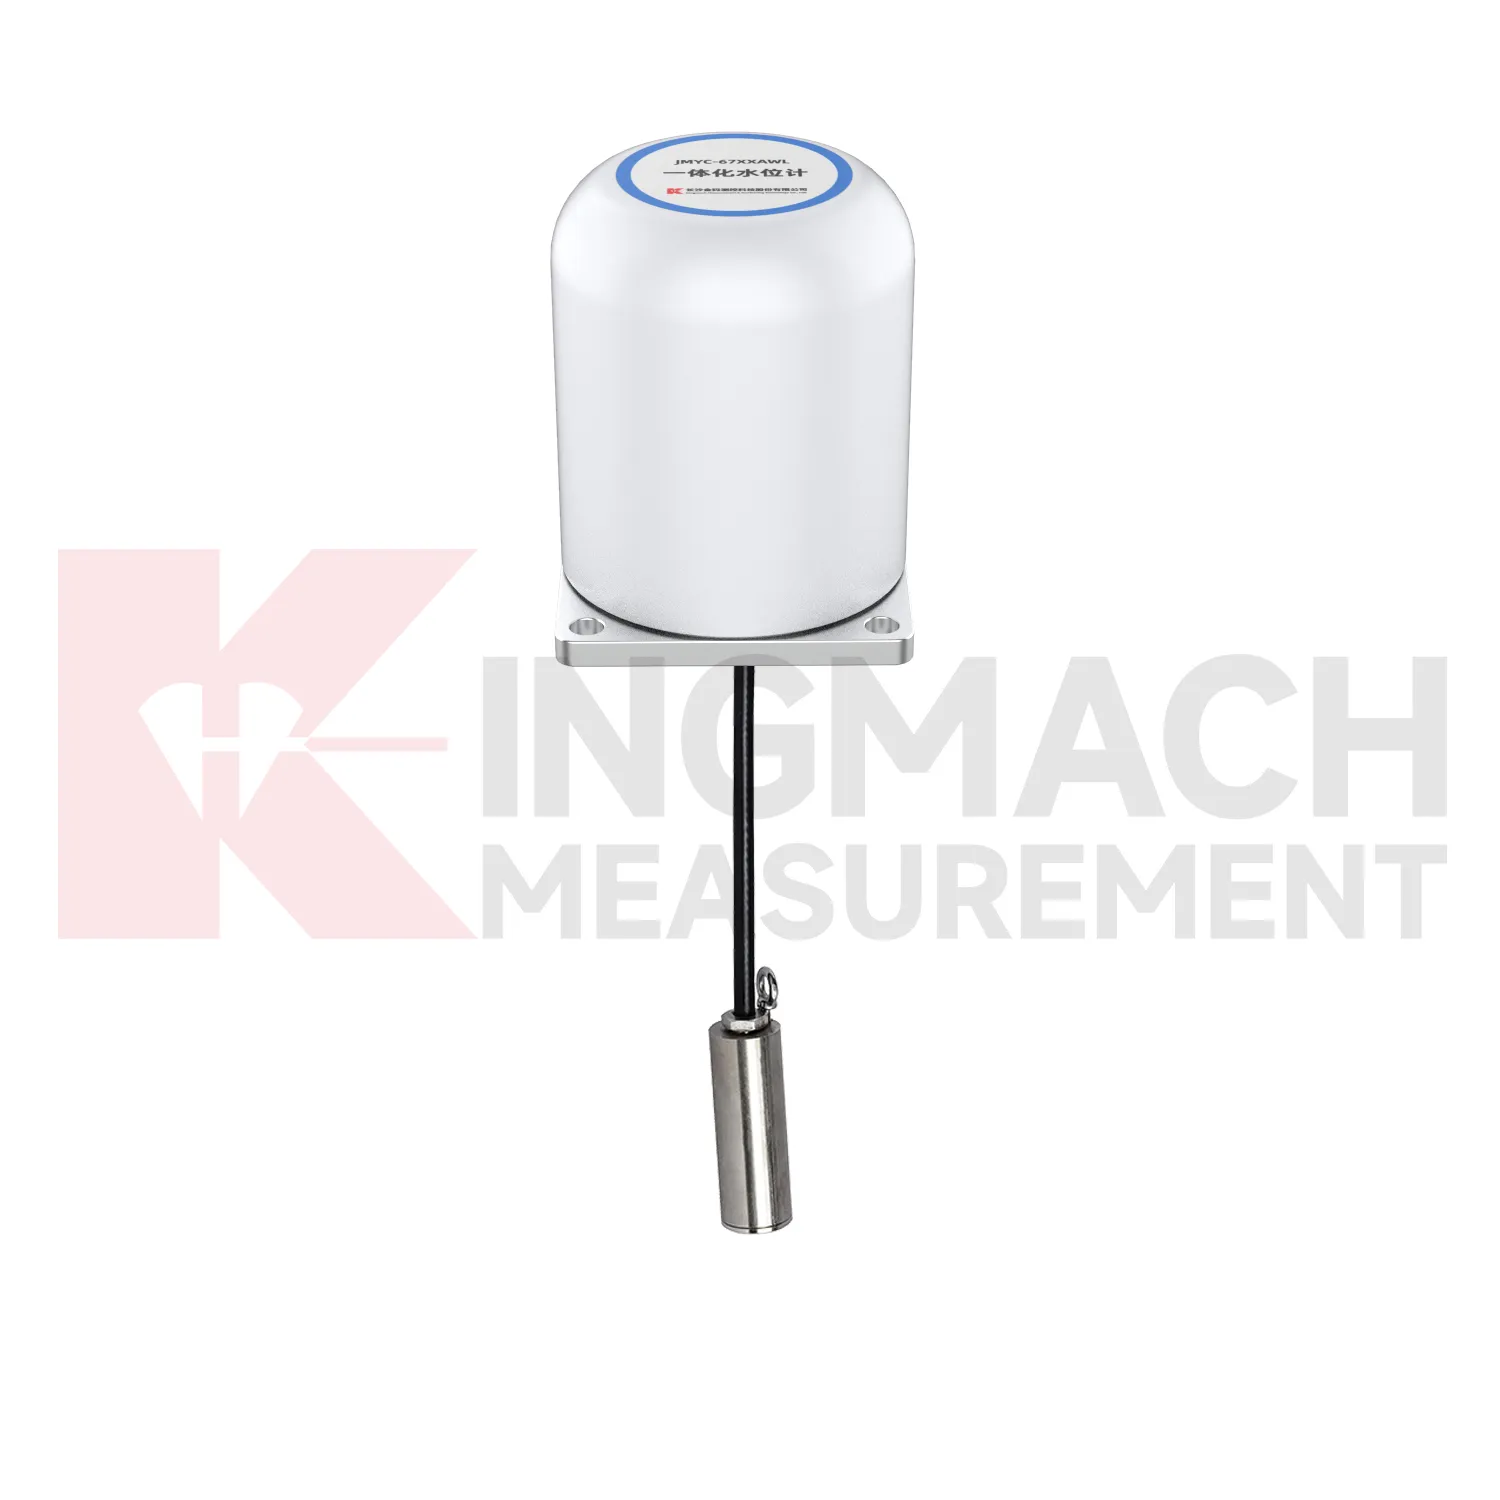
The next stage for load cell wiring diagram in infrastructure monitoring is tighter integration with site data systems. Smart sensors already store model data, calibration coefficients, zero values, temperature readings, and measurement records on selected Kingmach products. The practical path is to connect that identity data with 4G, LoRa, wired acquisition, or 5G gateways, then place the force trend beside displacement, settlement, pore pressure, and rainfall in the same review screen. This matters because future warnings will be less about one limit value and more about patterns: force rising after excavation, anchor load falling after heavy rain, or bridge cable force drifting during seasonal temperature cycles. Digital twin models can use those readings when the sensor location, range, and calibration background are reliable. Standards and owner specifications for structural health monitoring are also becoming more data traceability focused, which favors instruments that can carry their own calibration identity and remain readable through long service periods.
Care & Maintenance of load cell wiring diagram
For load cell wiring diagram, procurement and maintenance teams should agree on records before the product reaches the site. The box should not arrive as an anonymous device. The file should contain model, range, dimensions, calibration coefficient, certificate requirements, cable length, readout method, and any custom order notes. Axial force meters are often customized, with model, range, and dimension confirmed at order and lead time often planned around 20 to 30 days. During installation, check that the delivered item matches the support diameter, bearing plate layout, and data acquisition plan. During use, keep warranty, calibration, inspection, and repair notes together with the monitoring record. Protect the sensor from overload, impact, water entry, and unauthorized rewiring. If the project changes from manual reading to automated collection, verify scaling and units before comparing new data with older values. Maintenance is easier when the administrative record is as tidy as the hardware installation. Confirm changes before handover.
Kingmach load cell wiring diagram
load cell wiring diagram is often selected after a project team asks where force can change without being seen. In a tunnel, the answer may be the steel support. In a bridge, it may be a cable anchor or bearing. In a foundation pit, it may be a strut, anchor, or retaining wall contact zone. In a dam, it may be an anchor system affected by water level and temperature. Kingmach's monitoring product family allows these points to be linked with settlement sensors, displacement transducers, tiltmeters, piezometers, data loggers, and software platforms. That wider context matters because load change is rarely isolated. A rising force reading becomes more meaningful when it is checked against movement, pore pressure, and construction activity. A falling force reading may point to relaxation, seating loss, or damage near the bearing surface. The instrument gives the first clue, and the surrounding data explains it. It also makes abnormal values easier to discuss with designers, contractors, and maintenance teams.
FAQ
Q: What does load cell wiring diagram do in a foundation pit or tunnel? A: It measures axial force in steel supports, anchor load, or pressure change as excavation and support stages progress. Q: Which Kingmach model fits steel support axial force? A: The JMZX-38XXHAT axial force meter is listed from 200 kN to 3000 kN, with 0.1 kN or 1 kN sensitivity and 0.5%FS accuracy. Q: Is it suitable for wet underground sites? A: The axial force meter lists a 1 MPa waterproof rating, but connector sealing and cable routing still need inspection. Q: Why is direct kN display useful? A: It reduces confusion because teams can read axial force directly instead of converting vibrating wire frequency on site. Q: What should trigger extra checks? A: Excavation step changes, rainfall, dewatering, support adjustment, sudden force jumps, or unstable channels.
Reviews
James Thompson
The tiltmeters and accelerometers are very sensitive and provide precise data. Perfect for our structural health monitoring system.
Andrew Lee
The visualization software is intuitive and powerful. It helps us analyze monitoring data efficiently.
Latest Inquiries
To protect the privacy of our buyers, only public service email domains like Gmail, Yahoo, and MSN will be displayed. Additionally, only a limited portion of the inquiry content will be shown.
Emma***@gmail.comCanada
Dear Sir/Madam, we are interested in displacement transducers and settlement sensors for a geotechni...
Sophia***@gmail.comUnited Kingdom
Good day, we need environmental monitoring sensors including temperature, humidity, and wind sensors...