 ar
ar bg
bg hr
hr cs
cs da
da nl
nl fi
fi fr
fr de
de el
el hi
hi it
it ko
ko no
no pl
pl pt
pt ro
ro ru
ru es
es sv
sv tl
tl iw
iw id
id lv
lv lt
lt sr
sr sk
sk sl
sl uk
uk vi
vi et
et hu
hu th
th tr
tr fa
fa ms
ms hy
hy ka
ka ur
ur bn
bn mn
mn ta
ta kk
kk uz
uz ku
ku
load cell connection diagram
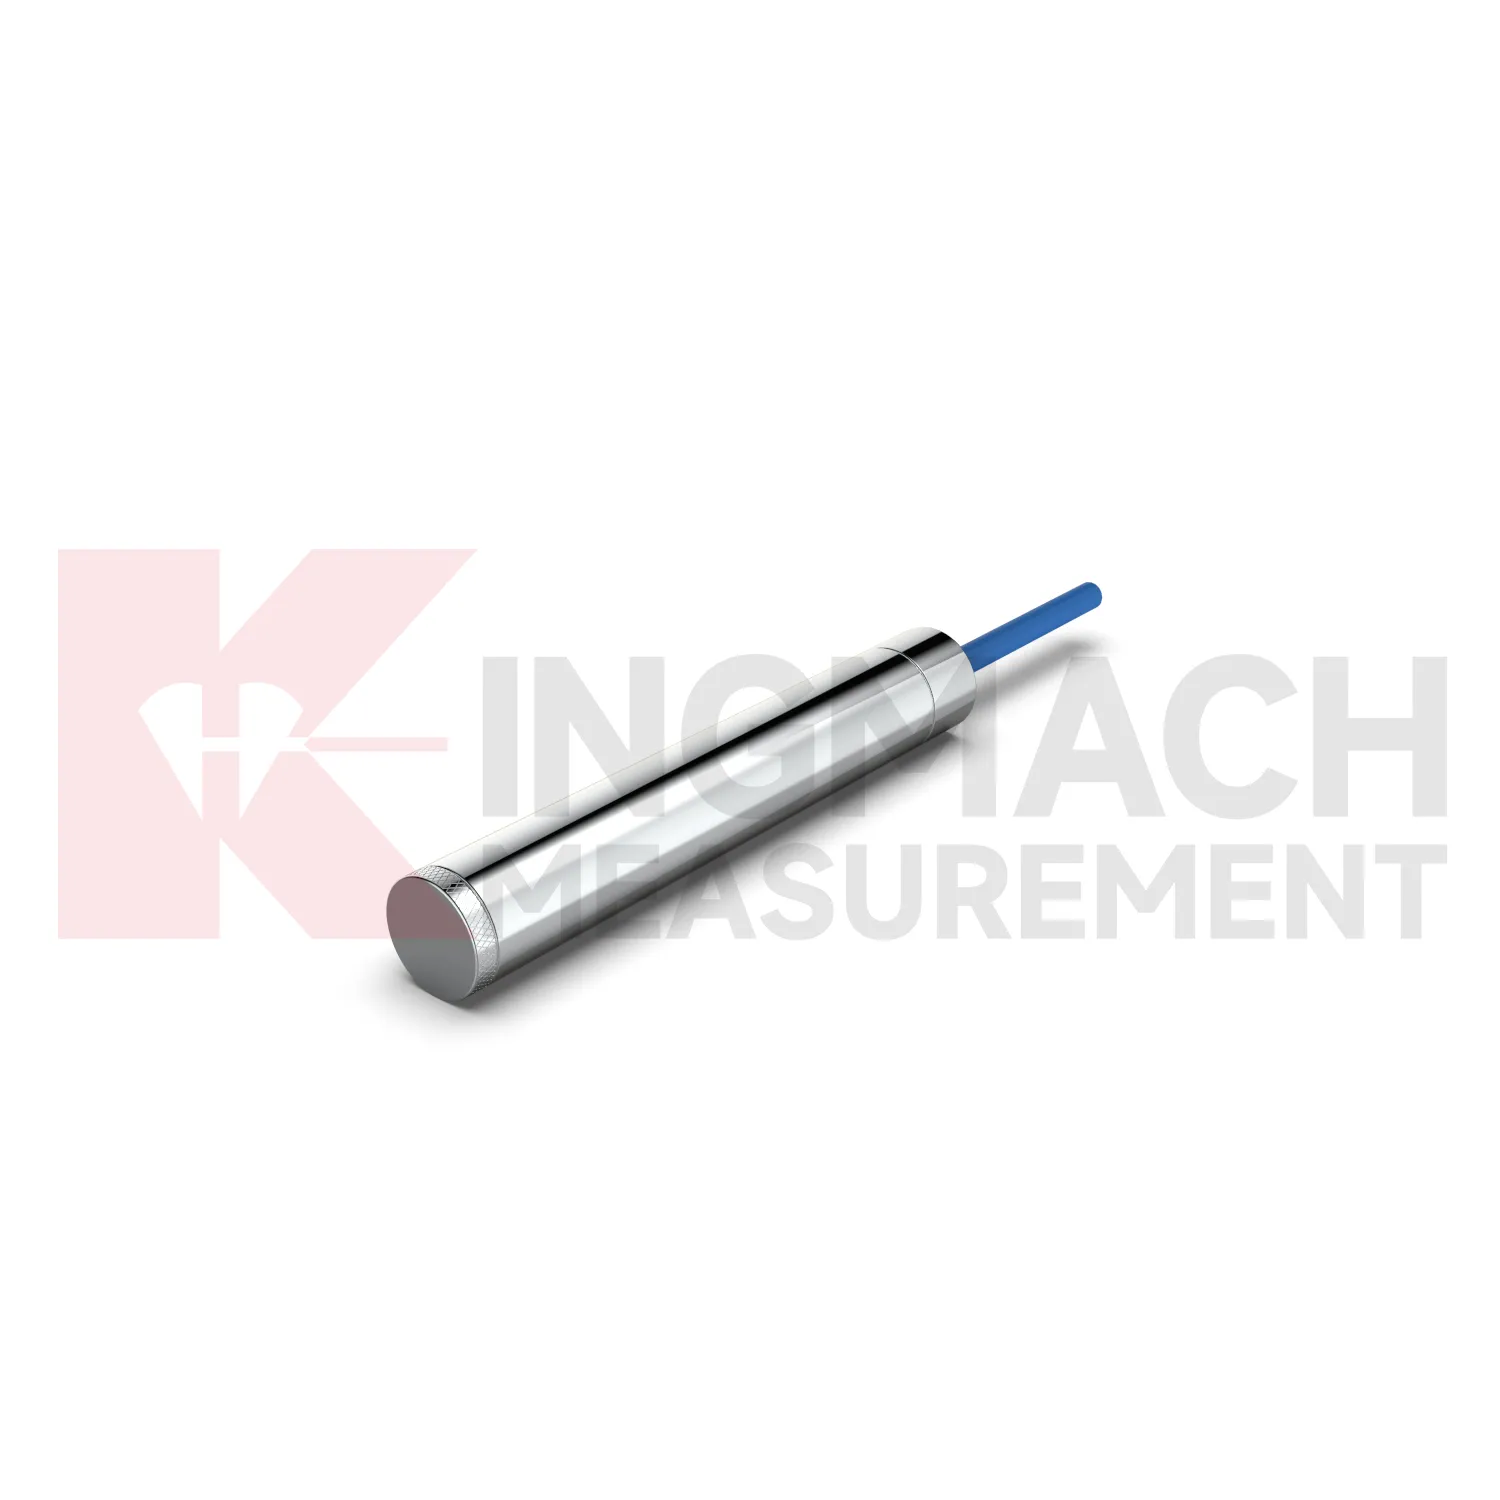
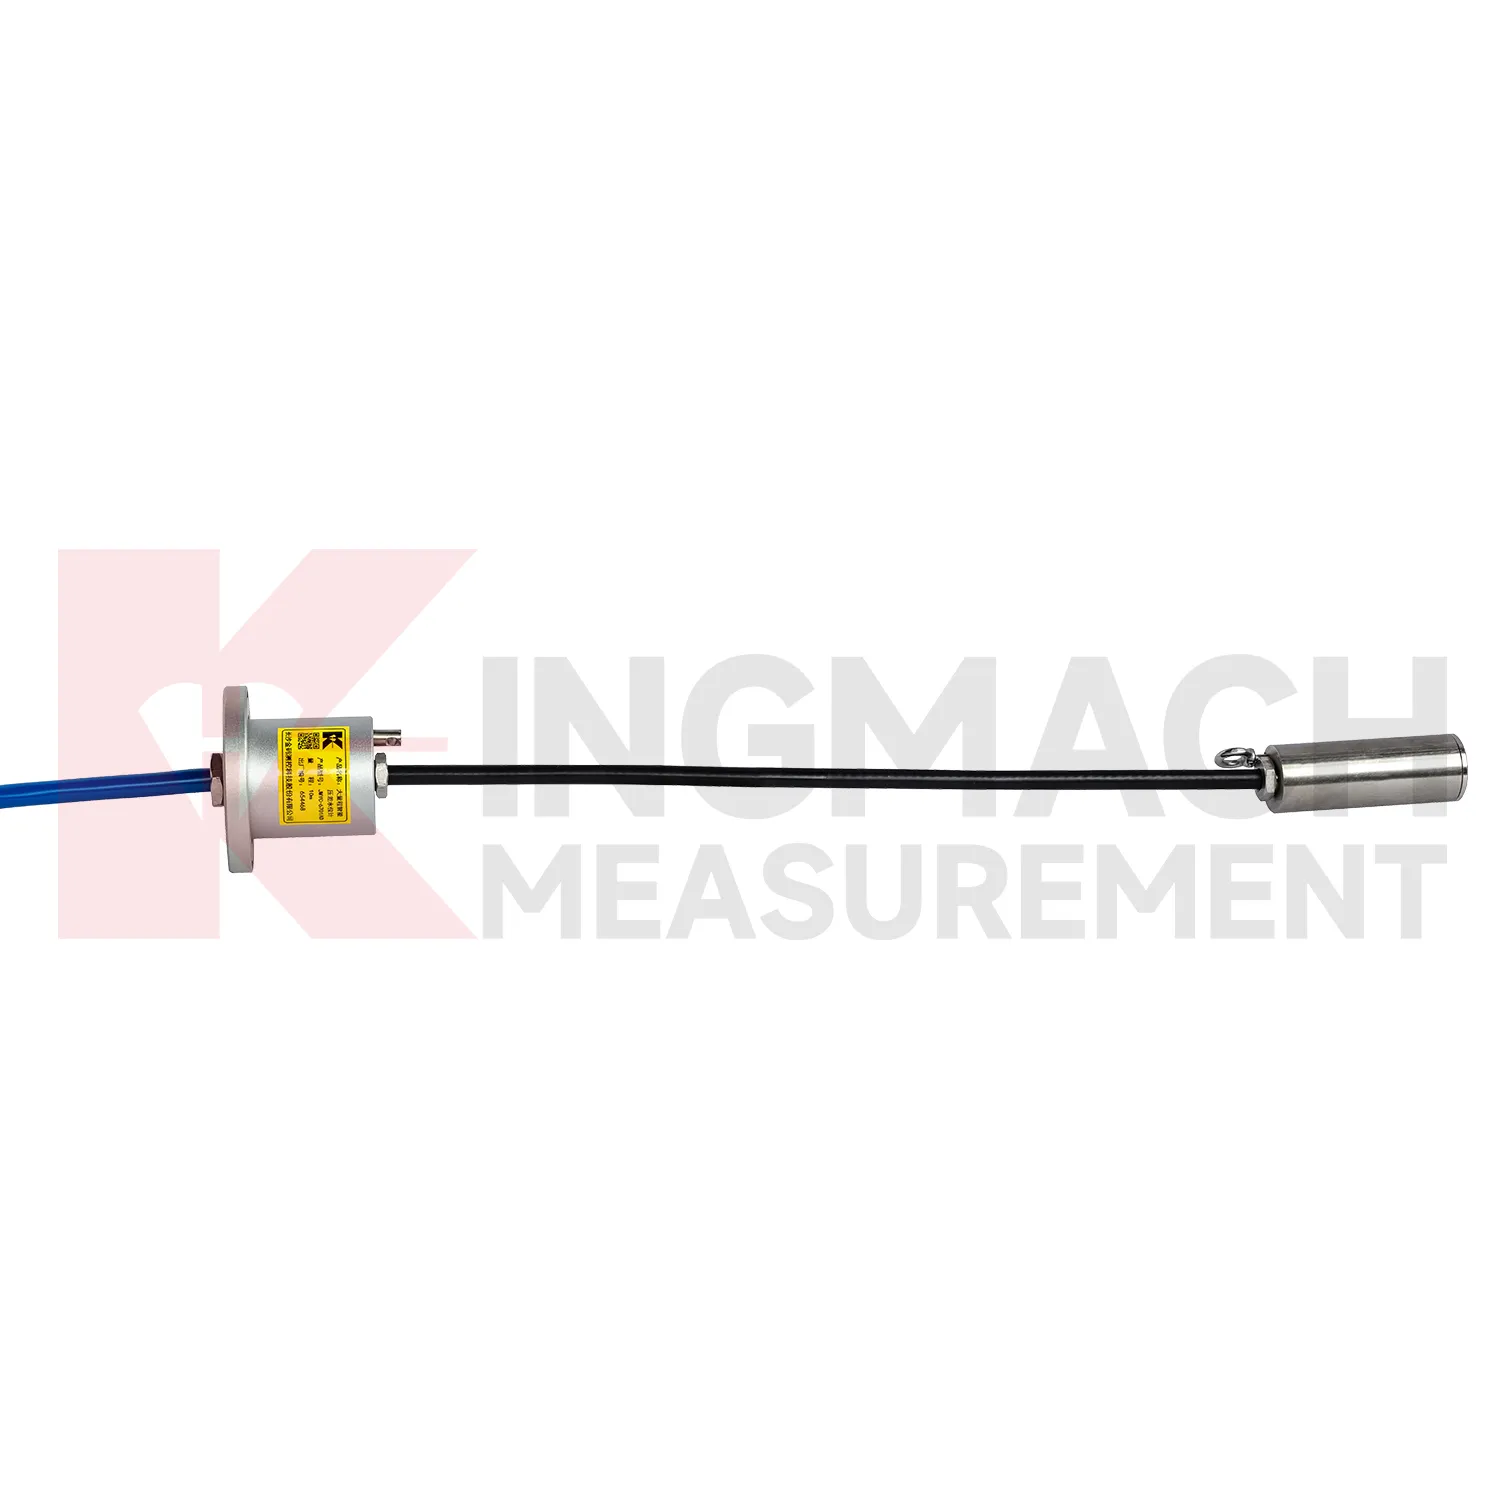
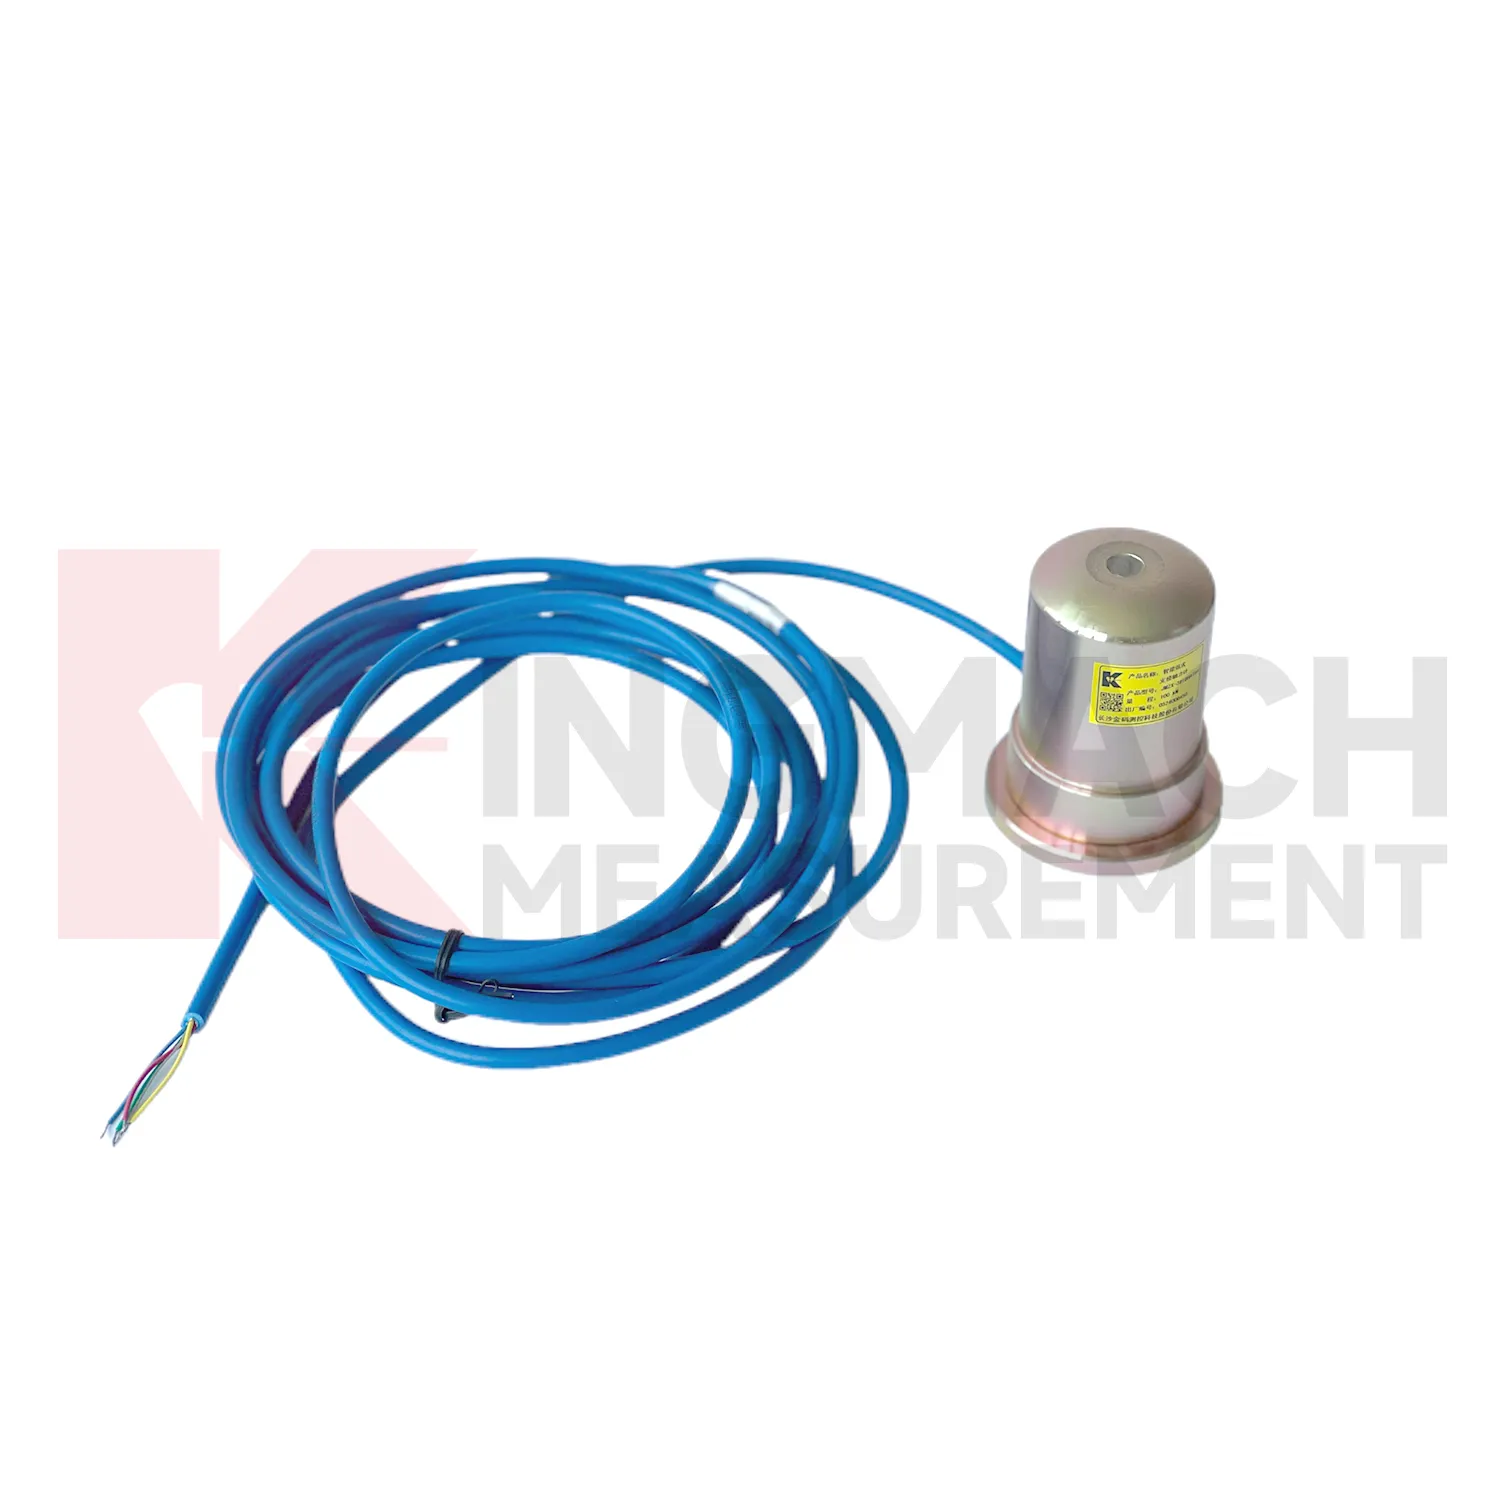
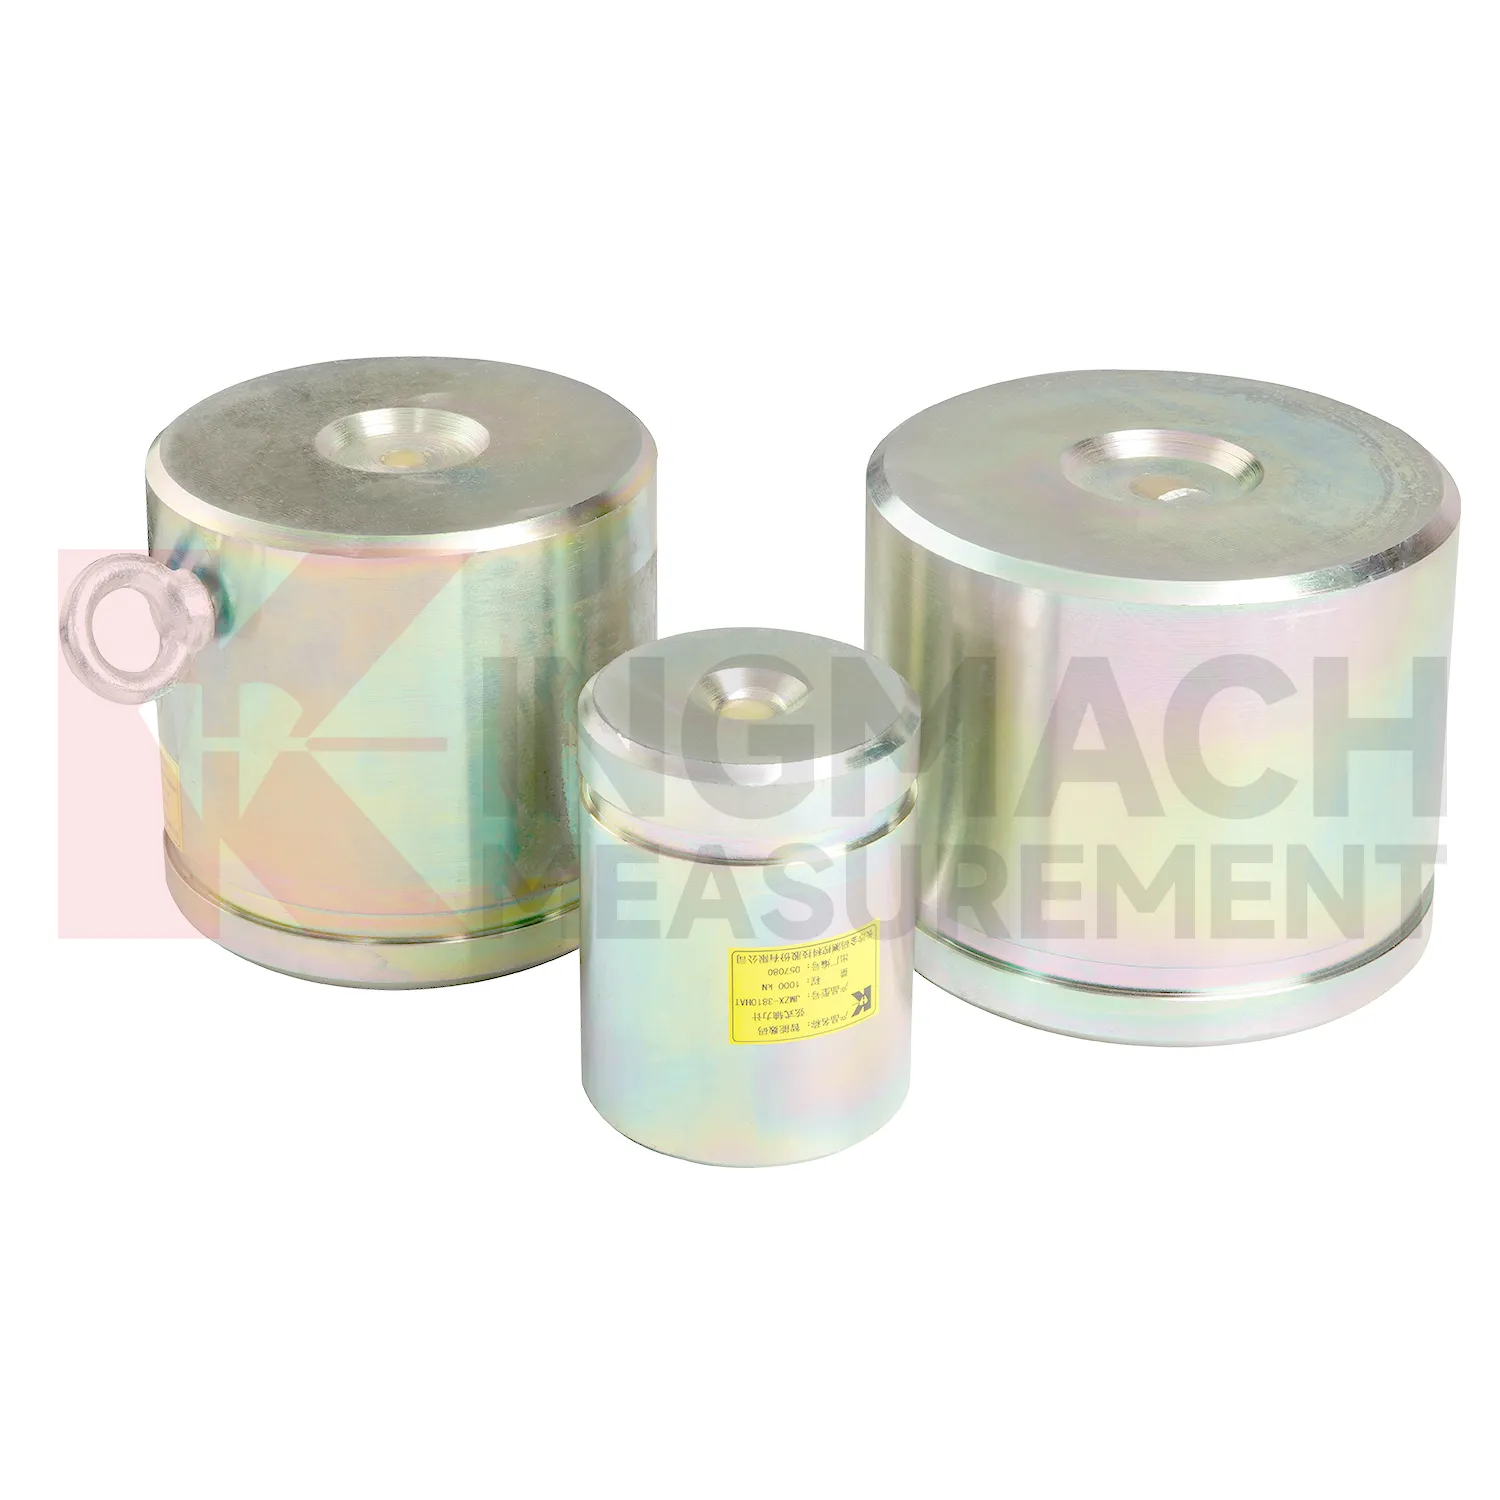
Kingmach load cell connection diagram is developed for civil infrastructure where readings must remain usable after dust, vibration, water, and long cable runs enter the job. Product files describe vibrating wire based designs, smart chips, digital detection, strong anti-interference transmission, waterproof insulation, and automatic temperature correction. On the solid load cell JMZX-35XXHAT, the listed range runs from 1000 kN to 10000 kN with 0.1 kN resolution and 0.5%FS precision. On the hollow JMZX-3XXXHAT series, the listed range covers 500 kN to 8000 kN and the record memory can store 800 measurement entries. On the JMZX-38XXHAT axial force meter, the instrument can display axial force directly in kN. These details suit projects where force monitoring is part of acceptance, construction control, or long term service review. Kingmach's product grouping also supports mixed monitoring networks, where load readings sit beside water level, piezometer, displacement, settlement, and tilt data. For purchasing teams, this means the specification should include not only the sensor body, but also compatible readout equipment, cable length, protection accessories, calibration needs, and the reporting method expected by the owner. That reduces changes after the site work has already started. In practice, this means the specification should name the monitored member, expected reading frequency, installation exposure, and the person responsible for accepting the first stable value.
Application of load cell connection diagram
In monitoring networks that cover several structures, load cell connection diagram gives force and pressure points a place beside displacement, settlement, tilt, vibration, water level, and environmental data. The project pain point is interpretation across many channels. A force increase in a foundation pit may be normal after excavation, while a similar increase on a dam anchor after water level change may need closer review. Kingmach smart sensors can store model data, calibration coefficients, zero values, temperature data, and up to 800 records on relevant models. Load ranges across the family include 200 kN to 10000 kN for force products and 0.3 MPa to 8 MPa for earth pressure cells. When connected through readouts, data loggers, DTUs, or software platforms, these points can be reviewed by location and time. Good channel naming, consistent units, alarm thresholds based on design stages, and periodic field checks prevent the network from becoming a pile of disconnected numbers. Large networks also need a naming convention that crews can understand on site. A channel label that matches drawings, physical tags, and software screens prevents mistakes when alarms arrive during night work or bad weather. The platform should keep the raw reading history available, so later reviewers can see whether an alarm came from a real trend or a setup change.
The future of load cell connection diagram
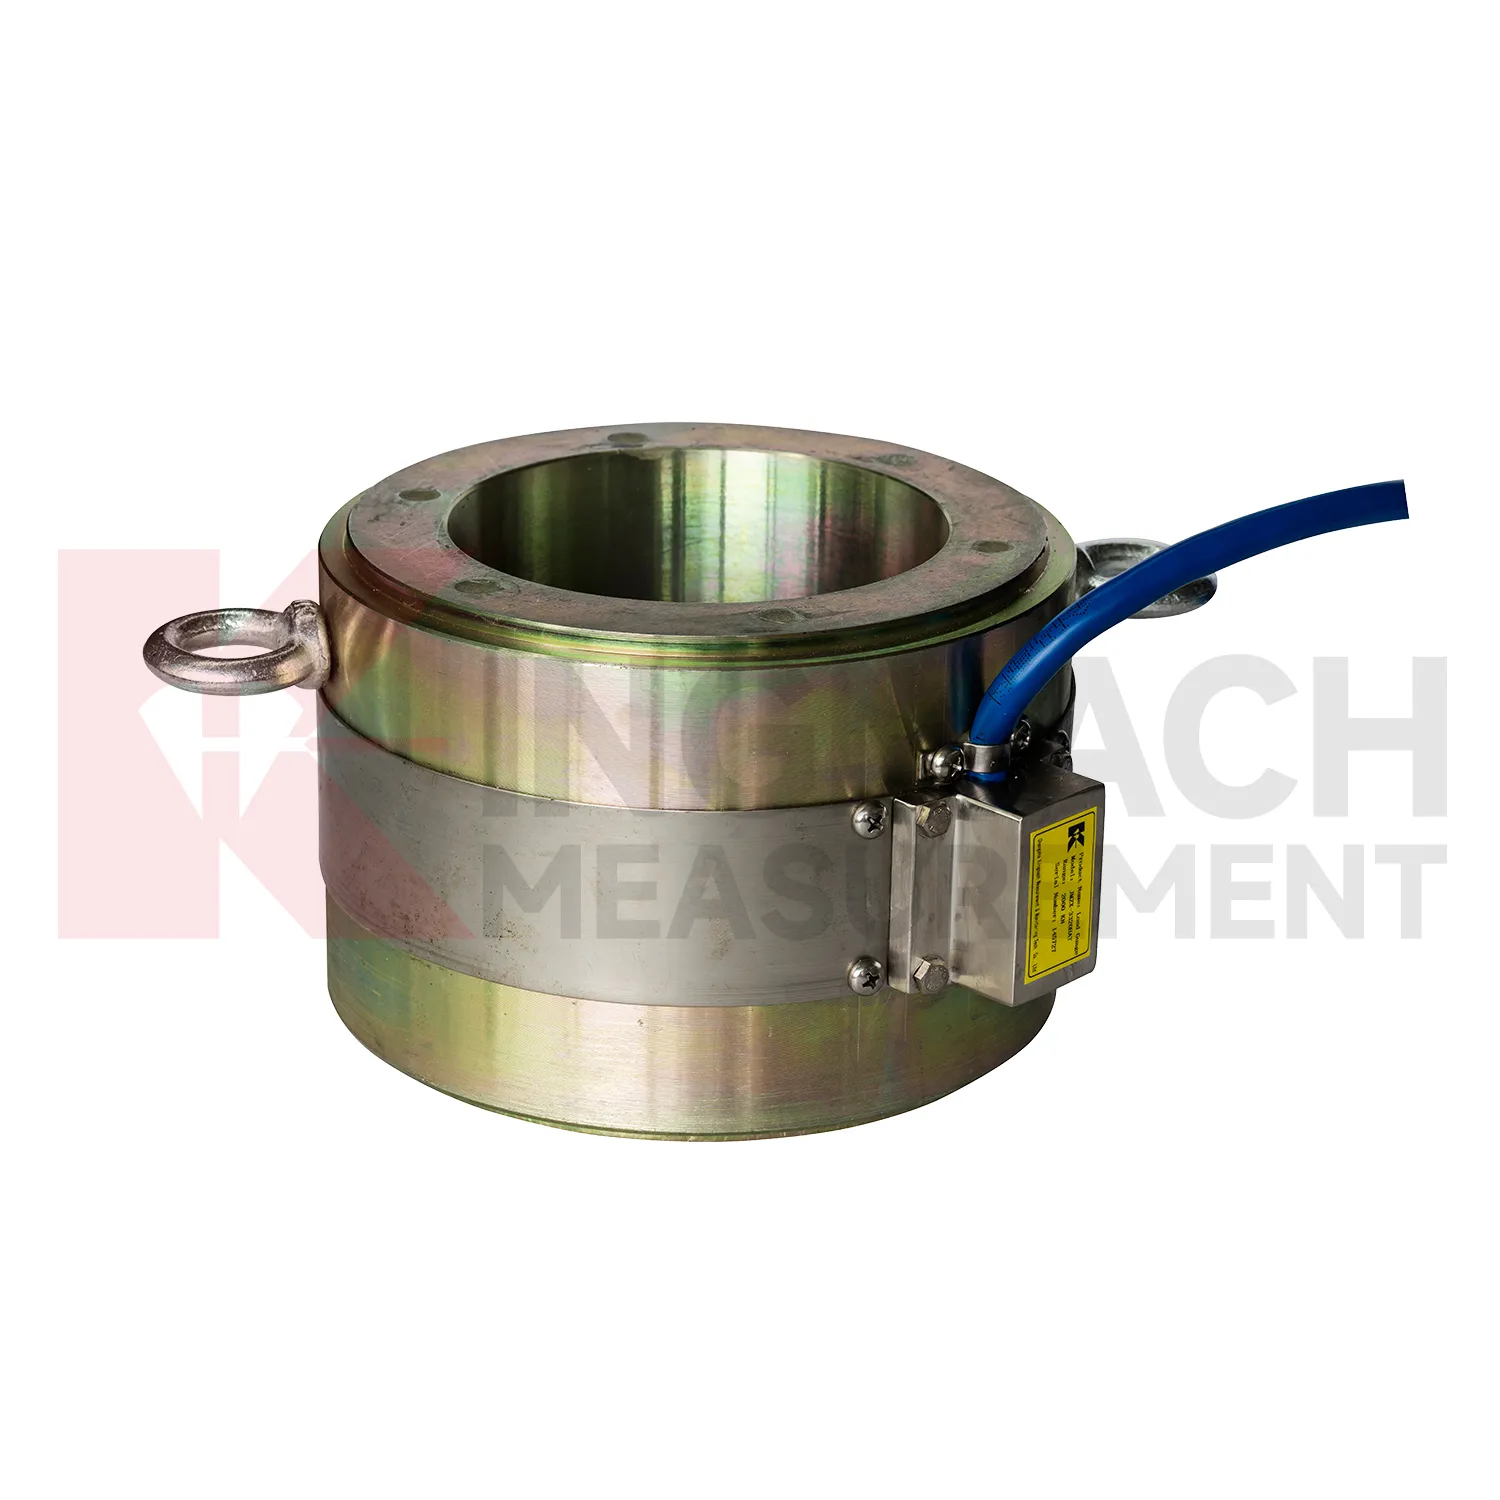
For bridge and cable supported structures, future load cell connection diagram work will likely combine high capacity sensing with digital inspection records. Hollow load cells with 500 kN to 8000 kN ranges and long service design can provide long term anchor or cable force data, while acquisition systems can bring those readings into owner platforms. The technical shift is toward trend based assessment: a cable force value is checked against temperature, traffic, wind, maintenance events, and nearby deformation. Wireless transmission may reduce site visits where access is difficult, although high risk points will still need protected cables, stable power, and field verification. As bridge monitoring requirements become more specific about traceability and response workflow, sensors with stored calibration data and temperature correction will be easier to manage. The most useful future system will not simply send alarms. It will show when the change began, which sensor recorded it, what else changed nearby, and whether the reading matches known structural behavior.
Care & Maintenance of load cell connection diagram
For load cell connection diagram, installation quality usually determines whether later maintenance is simple or painful. Before loading, confirm the model, range, calibration coefficient, zero value, bearing surface, and cable route. Hollow load cells may cover 500 kN to 8000 kN, while solid load cells may reach 10000 kN, so capacity should be checked against both working load and possible overload. During installation, keep bearing plates flat and strong enough to avoid stress concentration, especially on axial force meters and compression load points. Protect cables from bending, pulling, welding sparks, crushing, and water entry at connectors. After the first stable reading, record temperature, channel name, instrument serial information, and site condition. During long term use, inspect sealing, cable jackets, junction boxes, and acquisition channels after rainfall, excavation changes, jacking, or impact. If a value drifts, check temperature, connector condition, zero history, and nearby sensors before assuming the instrument has failed. Document who made the check.
Kingmach load cell connection diagram
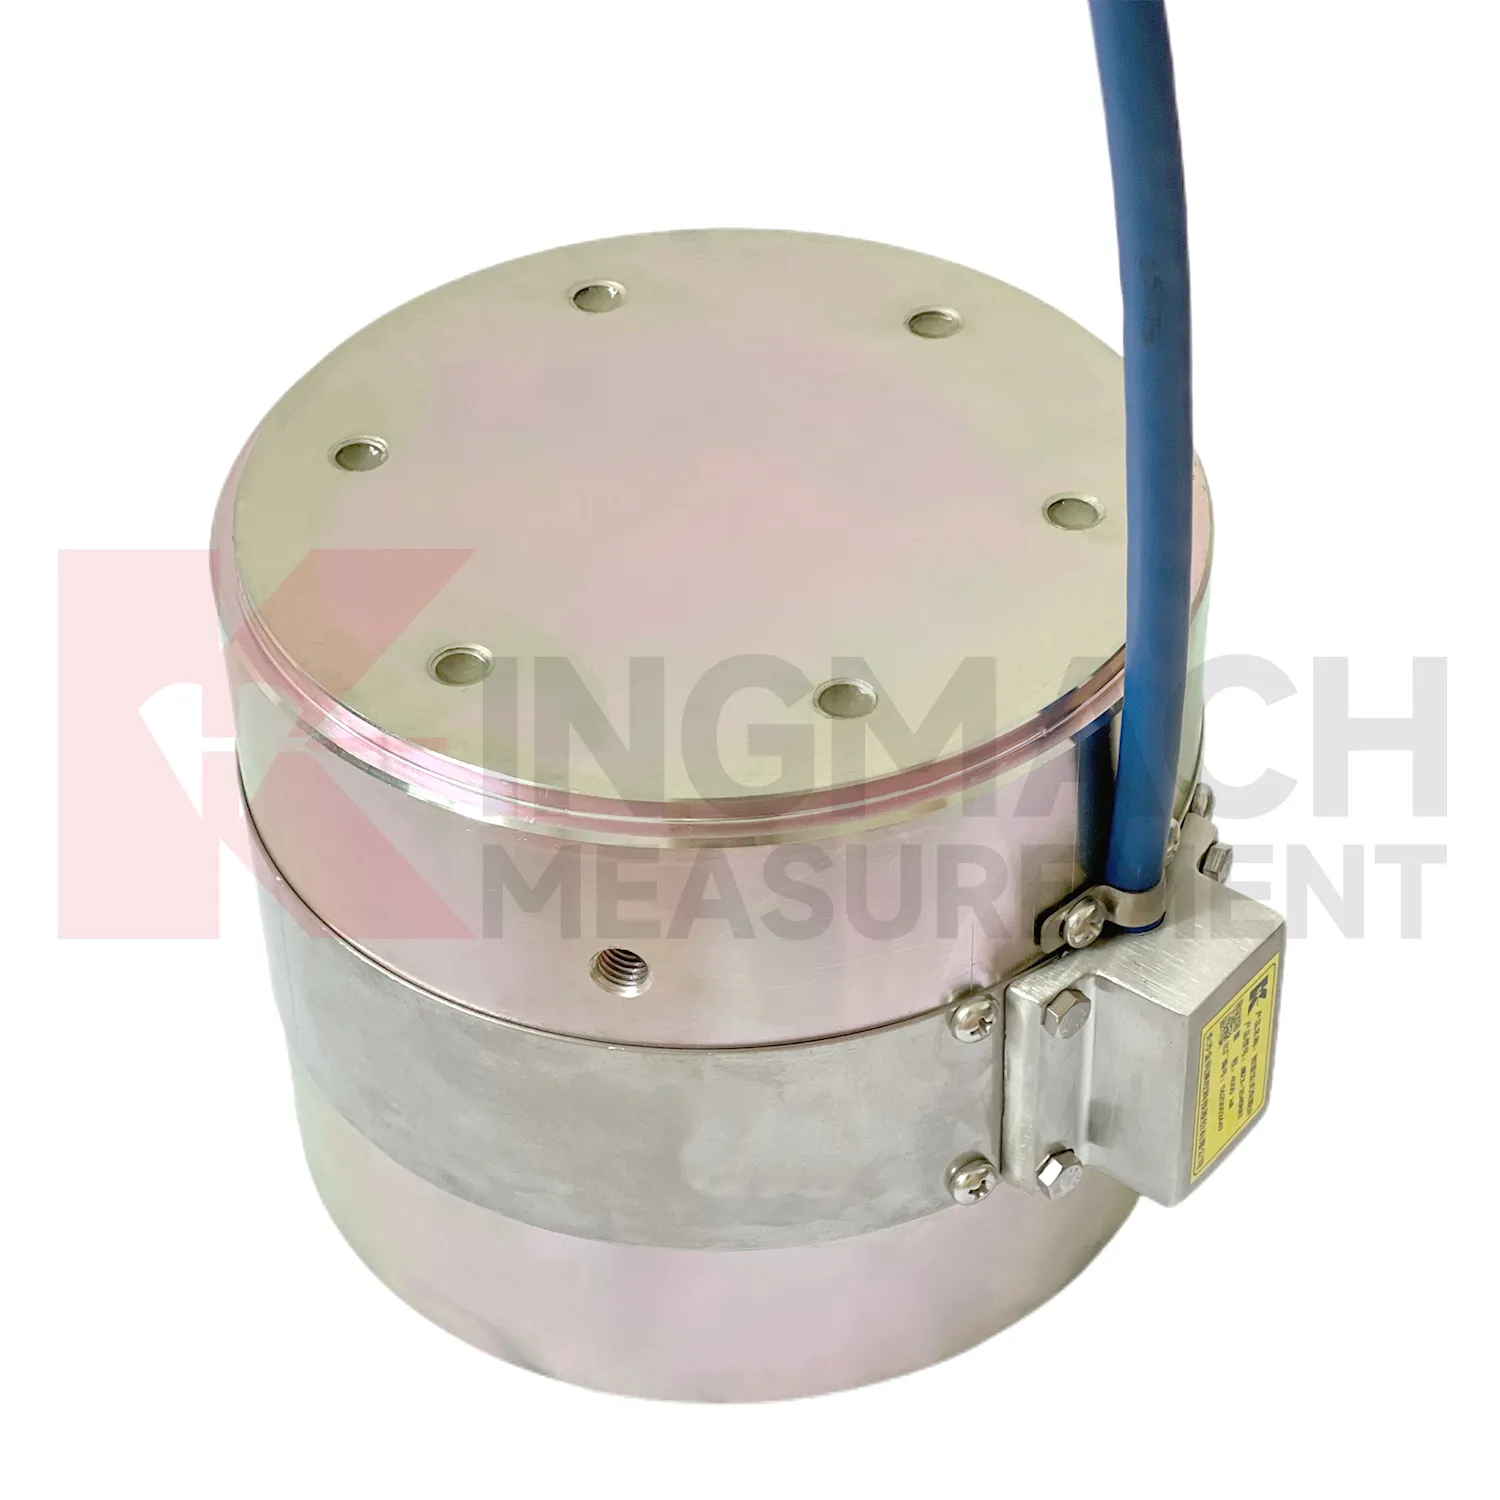
load cell connection diagram can be treated as a field witness for hidden force transfer in civil structures. Concrete, steel, soil, cable systems, and hydraulic loading may all look calm while the internal load path changes. Kingmach products in this category cover hollow load cells for anchors and cables, solid load cells for compression and pile testing, axial force meters for steel support loads, and earth pressure cells for contact pressure. Each type answers a different site question. Has the anchor lost tension? Is a pile test load centered? Is an excavation support taking more force after the next soil layer is removed? Is water pressure pushing the retaining structure harder after rain? The strongest monitoring records combine the sensor model, calibrated coefficient, zero value, temperature, reading time, and construction stage. That record gives owners a way to compare today with last week, last season, or the previous loading step, instead of relying on a single inspection note.
FAQ
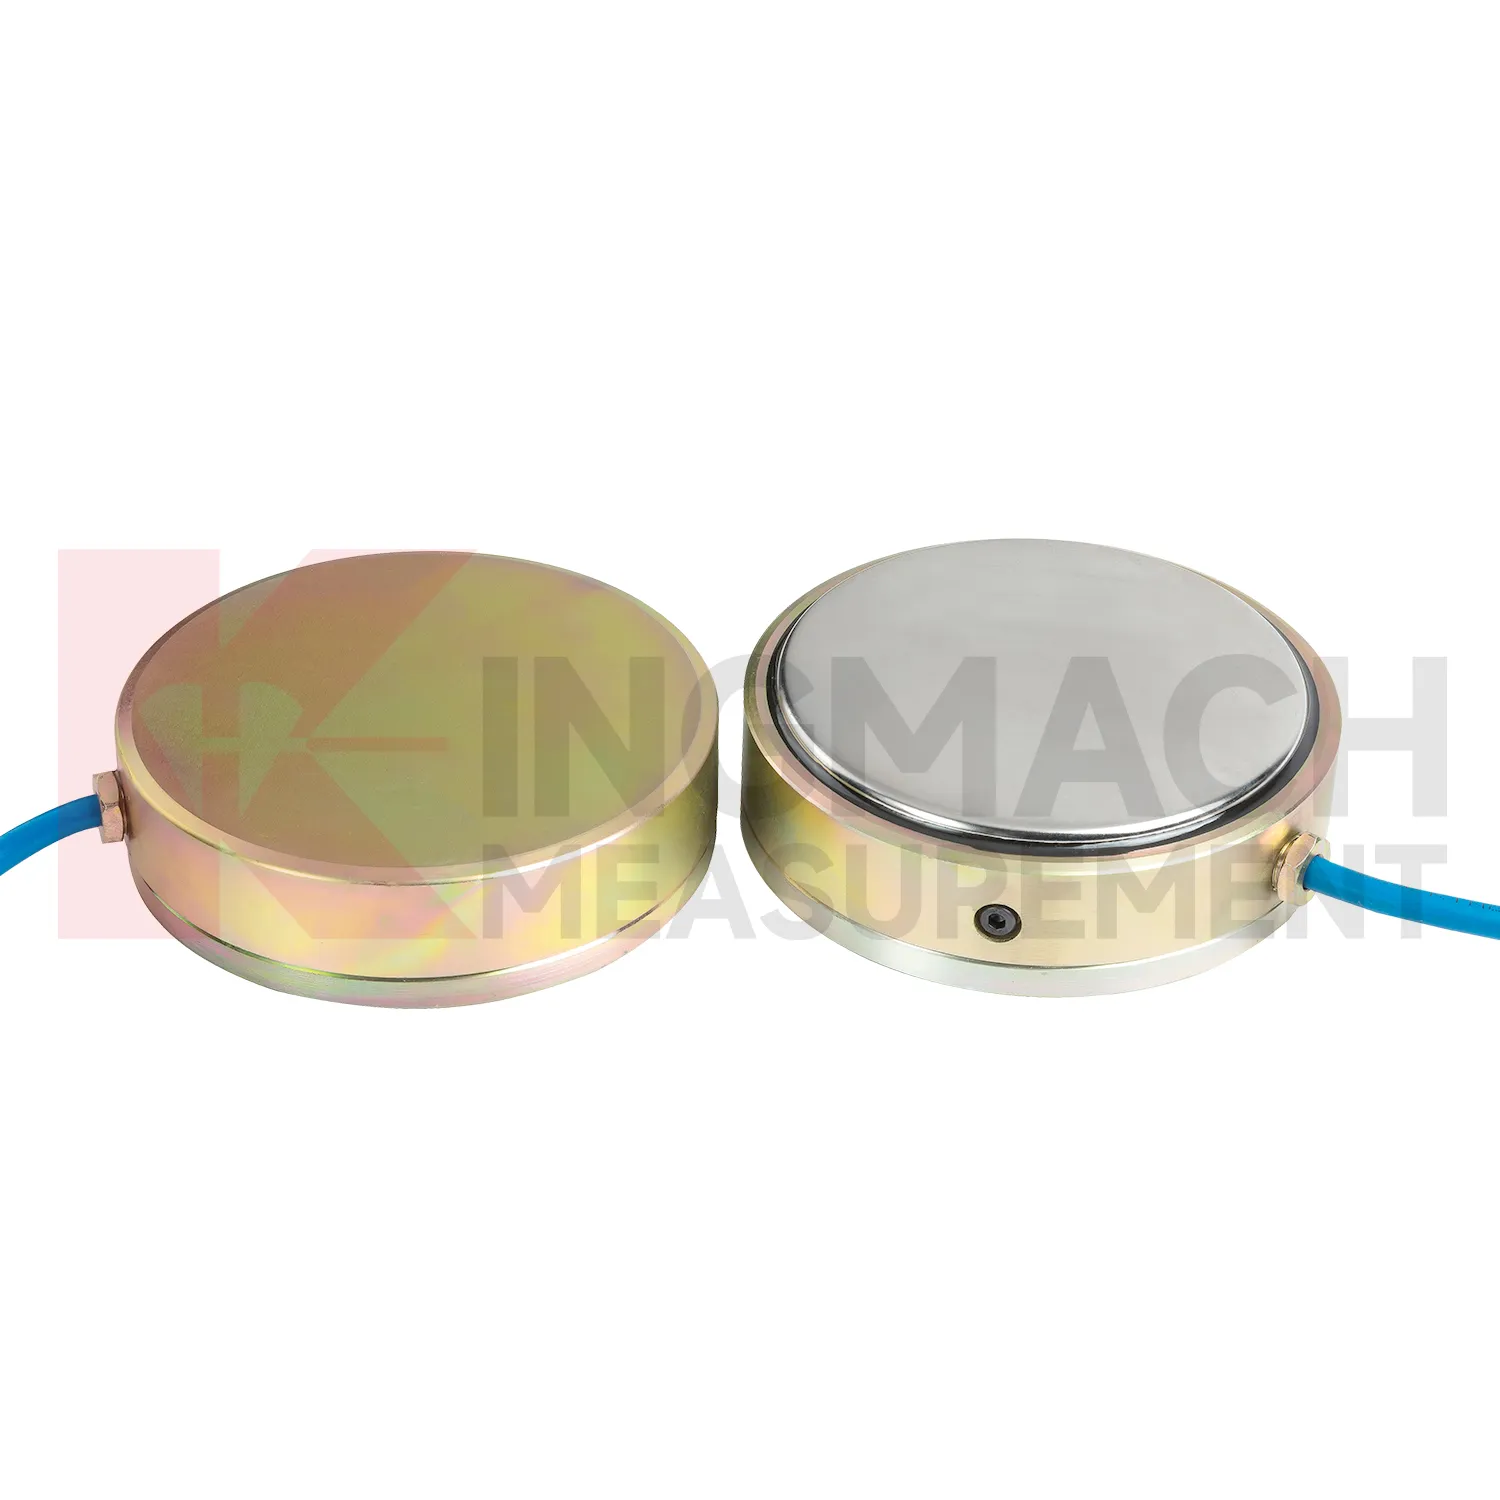
Q: How should load cell connection diagram be selected for a bridge cable or anchor point? A: Start with expected force, lock-off load, possible overload, bearing geometry, and access for later inspection. Hollow load cells are commonly used where the anchor or cable passes through the center opening. Q: What range information is available from Kingmach hollow models? A: The JMZX-3XXXHAT series is listed from 500 kN to 8000 kN, with 0.1 kN sensitivity on the 500 kN model and 1 kN on larger listed models. Q: Why does temperature correction matter? A: Cable and anchor readings can move with temperature, so built-in temperature measurement helps reduce false interpretation. Q: Can readings be stored inside the sensor? A: Smart hollow models list storage for 800 measurement records, including time, temperature, zero values, and correction data. Q: What should be checked after installation? A: Check seating, cable protection, connector sealing, zero value, first stable force, and matching channel name.
Reviews
James Thompson
The tiltmeters and accelerometers are very sensitive and provide precise data. Perfect for our structural health monitoring system.
Christopher Martinez
Very satisfied with the readouts & data loggers. User-friendly interface and supports multiple sensor inputs.
Latest Inquiries
To protect the privacy of our buyers, only public service email domains like Gmail, Yahoo, and MSN will be displayed. Additionally, only a limited portion of the inquiry content will be shown.
Sophia***@gmail.comUnited Kingdom
Good day, we need environmental monitoring sensors including temperature, humidity, and wind sensors...
Charlotte***@gmail.comUnited Arab Emirates
Hi, we require instrumentation cables suitable for harsh environments. Could you advise on specifica...